Traditional television coverage uses a sideline camera (for the most part), however, so I developed a new graphing approach using this perspective. One benefit of mapping the locations and angles of spike attempts is that doing so provides richer information than a typical box score. For example, a box score would list how many attempts, kills, and errors were recorded by a middle-blocker. However, there would be no way to distinguish spikes taken by middle blockers from the actual middle of the front row from those taken on slide plays, on which the middle blocker runs over to the far-right side to evade his or her blocker and attacks from there.
I graphed four different games/sets from this past weekend, from three different matches. Let's take a look first at Game 4 from Stanford's five-game win over UCLA last Friday night (you may click on the graphics to enlarge them).
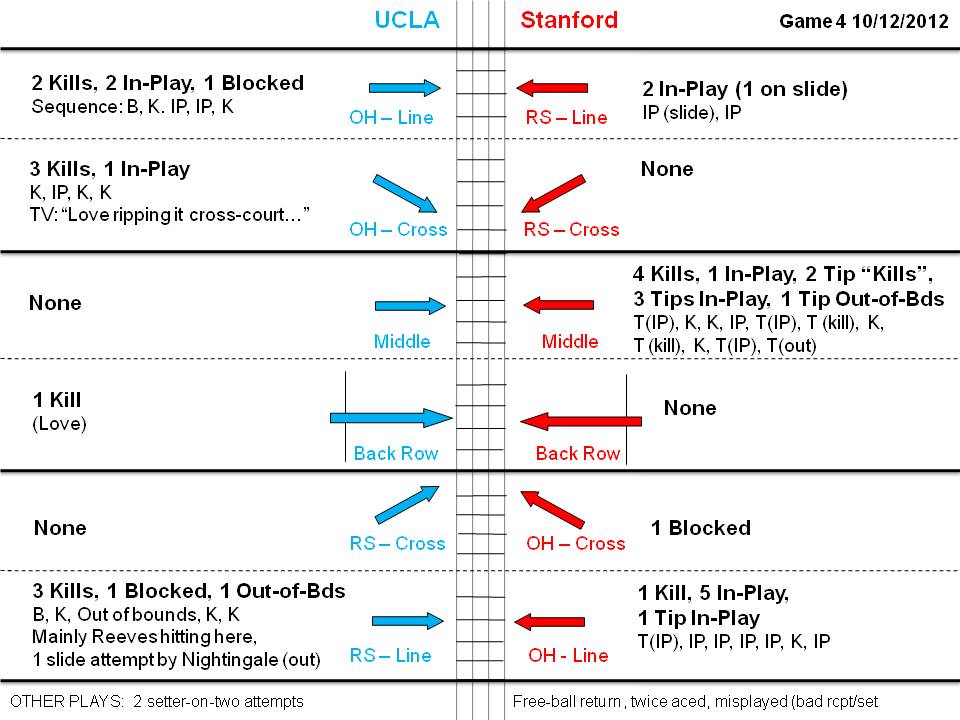
I think most of the terms should be self-explanatory. Just to clarify a few that may be unclear, "In Play" refers to an attack that remained in play due either to being blocked back to the attacking team, which could then start over, or being dug by the defensive side. All plays refer to hard-hit spike attempts, unless the attack is described as a "Tip." All attacks were categorized according to the location from which the ball was attacked, not necessarily the position with which a given player is identified (e.g., the aforementioned slide attack, which is undertaken by a middle hitter, is listed as emanating from the right-hand side).
As can be seen, the teams showed contrasting approaches. UCLA focused on the "pins" (the right and left antennae at the ends of the net), whereas Stanford stormed the middle. For the Bruins, Tabi Love went to town with cross-court spikes from the left end, drawing the exclamation noted in the chart. Shoring up the right side was Kelly Reeves. For Stanford, Carly Wopat and Inky Ajanaku recorded kills in the middle; it also looked to me like Rachel Williams hit some balls in the middle, but she is officially listed as an outside hitter (I could be wrong).
Before looking at the remaining charts, I want to mention four limitations in these depictions:
1. They only show the attacks launched upon serve-receipt, not any attacks in transition.
2. For the most part, they present only team totals for a given avenue of attack, rather than statistics for individual players. I do have a few exceptions in which individual hitters are identified. However, the speed of the game makes it difficult to identify particular players in many instances.
3. As long as the television broadcasts stuck to sideline views, my charts should be highly accurate. However, when a different angle (e.g., end-zone) was presented, I faced a spatial-rotation challenge to convert the shown angle to the sideline-angle format of the charts.
4. There were a few plays (noted in the fine print) that I just flat-out missed, for example, because I was still writing down the information for one play while the next serve was being struck.
Next, let's look at Game 2 of USC's three-game sweep of Cal across the Bay. The Golden Bears enjoyed success on slide plays featuring Correy Johnson, but little else. USC went several times to outside hitter Samantha Bricio, but the Mexican frosh had difficulty on the evening, hitting only .167 (she also struggled two nights earlier against Stanford, hitting -.043).

Lastly, I looked at two games (1 and 2) from Sunday's Minnesota-Nebraska match. One game may or may not provide a valid microcosm of an entire match, so I decided to look at two games in this instance. The Golden Gophers took the first game, but the Cornhuskers roared back to take the next three.
In Game 1, the Gophers amassed 17 kills, which were relatively evenly distributed among five players: OH Katherine Harms 5, MB Tori Dixon 4, OH Ashley Wittman 3, OH Daly Santana 3, and MB Dana Knudsen 2 (play-by-play sheet). As shown below, eight of those Minnesota kills occurred immediately off of serve-receipt. Five of the eight stemmed from slide plays or quick sets down the middle.

In winning Game 2, Nebraska exhibited a variety of ways to produce kills on serve-receipt: a couple of cross-court spikes from the outside hitters, a couple of slides, a tip here and there. The Huskers were also aided by four Gopher service errors.

In conclusion, I think these charts offer a lot of information at a glance, even with their imperfections (e.g., difficulty in identifying particular players from television broadcasts). If I get a chance, I will try to map the action from watching a match in person. If archived videos are available, analysts can go back to enhance the detail provided in the chart.

No comments:
Post a Comment