Thursday, December 20, 2012

NCAA Women's Final Four Wrap-Up: Powerful Texas Overcomes Grind-it-Out Michigan and Oregon

Looking back on this past weekend's NCAA women's Final Four, what stands out to me is the contrast in teams' strong suits. The champion Texas Longhorns set the ball high, hit over the block, and delivered surgical strikes to win points quickly. Michigan and Oregon, UT's opponents in the semifinals and finals, respectively, got as far as they did with more of a grind-it-out approach. Defensively, Michigan and Oregon persistently dug opponents' spike attempts, and when the Wolverines and Ducks went on offense, they sometimes would need multiple hitting attempts on a single rally to finally put the ball away.

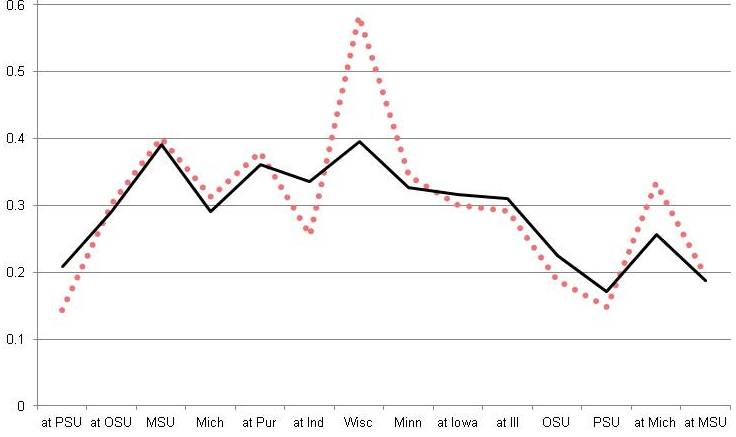
The following graph conveys the Longhorns' devastating offensive prowess in their final three matches of the tournament (vs. USC in the Elite Eight, and the Michigan and Oregon matches). In addition to the conventional hitting-percentage statistic ([Kills - Errors]/Total Attempts), I have presented a slight variation, namely kill percentage (Kills/Total Attempts). You may click on the graphics to enlarge them.


Against USC, the Longhorns achieve a kill on half the swings they took (.505, 50/99), whereas the other three Final Four teams all had kill percentages in the high .30s in their Elite Eight matches. Then, in the final, a 25-11, 26-24, 25-19 Longhorn win over the Ducks (box score), UT nearly reached .500 in kill percentage again, clocking in at .483 (43/89).

If a team commits no hitting errors, then kill percentage and hitting percentage are equal to each other. That the black and orange bars for Texas against Oregon are nearly equally tall tells us that the Longhorns made very few attack errors in that match -- 4 to be exact, compared to 43 kills on 89 swings. As a further sign of how unstoppable Texas was offensively, Oregon came up with only 1 team block in the final, compared to the Longhorns' 15.

In the semifinal round, Michigan extended Texas to five games, with the Longhorns prevailing 25-11, 21-25, 23-25, 25-12, 15-11. For the match as a whole,Texas's hitting percentage of .316 was literally double Michigan's .158. However, when game-specific hitting percentages are examined, we can see that in the two sets the Wolverines won, they somehow managed to slow down the Horns' offense, while raising their own hitting percentages into the mid-high .200s.


Above, I characterized Michigan as having a "grind-it-out" style, for which being able to dig opposing spikes to keep setting up the offense is essential. As one possible measure of a team's grind-it-out propensity, I've simply taken that team's total number of attack attempts (TA) in a given match and divided it by the total number of points in the same match (to control for match length). Looking at all matches in the Sweet 16 and beyond (a total of 15 matches and thus 30 team-specific values), Michigan took first and second in grind-it-out propensity:

Mich (vs. Tex): 193 total points, Mich 196 TA (1.02)
Mich (vs. Stan): 180 total points, Mich 173 TA (.961)
IowaSt (vs Stan): 127 total points, ISU 121 TA (.953)
Stan (vs. IowaSt): 127 total points, Stan 118 TA (.929)
Ore (vs. PSU): 195 total points, Ore 176 TA (.903)
Min (vs. Pur): 192 total points, Minn 173 TA (.901)
Pur (vs. Min): 192 total points, Pur 173 TA (.901)
Neb (vs. Ore): 172 total points, Neb 155 (.901)
Ore (vs. BYU): 178 total points, Ore 159 TA (.893)
Ore (vs. Neb): 172 total points, Ore 151 TA (.878)
Ore (vs. Tex): 130 total points, Ore 114 TA (.877)

Oregon had four of the top 11 grind-it-out values. Grind-it-out teams will not always out-dig their opponents, as a lot of their own spikes are being dug. Indeed, Texas out-dug Michigan 76-71. However, Oregon did out-dig Penn State 80-67 in their national semifinal match (box score).

With the exception of the Michigan match, Texas didn't take that many swings in its final three matches, yielding relatively low grind-it-out ratios for the Longhorns: (vs. USC, 99 swings/130 points =.762; vs. Michigan 158/193 = .819; and vs. Oregon, 89/130 = .685).

***

My Conference-Adjusted Combined Offensive-Defensive (CACOD) ranking, which is based almost entirely on teams' regular-season hitting percentages and the hitting percentages they allowed their opponents, correctly predicted 47 of the 63 tournament matches this year. Thus, the CACOD placed right up there with other, more established ranking systems (screen capture from here):


For each of the 63 tournament matches (shown below), the team with the higher CACOD ranking (shown in parentheses) would be predicted to win. Matches in which the team with the higher CACOD lost are shown in red.

1st Round (26-6)

PSU (1) d Bing (63) 3-0
BGSU (51) d Yale (47) 3-2
Ohio St (28) d ND (34) 3-0
Ky (33) d ETS (59) 3-0
FSU (6) d Hof (61) 3-0
Pur (23) d ColSt (20) 3-0
Crei (14) d Marq (27) 3-0
Minn (13) d Lib (60) 3-0

Ore (9) d NCol (55) 3-0
Day (17) d Pepp (48) 3-2
Ok (37) d ASU (39) 3-2
BYU (4) d NMSU (38) 3-0
Wash (8) d CArk (49) 3-0
Haw (18) d SClara (54) 3-0
UNI (31) d KSt (21) 3-0
Neb (5) d MdES (53) 3-0

Tex (2) d Colg (64) 3-0
TAMU (29) d NCSU (41) 3-1
CofC (57) d Mia (22) 3-2
Fla (7) d Tulsa (43) 3-0
KU (10) d CleveSt (42) 3-1
WichSt (46) d Ark (36) 3-2
StM (52) d SDSU (35) 3-2
USC (12) d Fair (58) 3-0

UCLA (11) d LIU (45) 3-0
MichSt (15) d USD (40) 3-2
Mich (26) d Tenn (32) 3-2
Lou (16) d Bel (62) 3-1
IaSt (24) d IPFW (56) 3-2
NCar (25) d Cal (30) 3-1
WKy (19) d LMU (44) 3-0
Stan (3) d JxSt (50) 3-0

2nd Round (11-5)

PSU (1) d BGSU (51) 3-0
Ky (33) d OhioSt (28) 3-1
Pur (23) d FSU (6) 3-2
Minn (13) d Crei (14) 3-1

Ore (9) d Day (17) 3-0
BYU (4) d Ok (37) 3-0
Wash (8) d Haw (18) 3-2
Neb (5) d UNI (31) 3-0

Tex (2) d TAMU (29) 3-1
Fla (7) d CofC (57) 3-0
WichSt (46) d KU (10) 3-1
USC (12) d StM (52) 3-0

Mich St (15) d UCLA (11) 3-1
Mich (26) d Lou (16) 3-1
IaSt (24) d NCar (25) 3-2
Stan (3) d WKy (19) 3-0

3rd Round (6-2)

PSU (1) d Ky (33) 3-0
Minn (13) d Pur (23) 3-1

Ore (9) d BYU (4) 3-1
Neb (5) d Wash (8) 3-0

Tex (2) d Fla (7) 3-0
USC (12) d Wich St (46) 3-0

Mich (26) d MSU (15) 3-0
Stan (3) d Iowa St (24) 3-0

4th Round (2-2)

PSU (1) d Minn (13) 3-1
Ore (9) d Neb (5) 3-1
Tex (2) d USC (12) 3-0
Mich (26) d Stan (3) 3-1

Final Four (1-1)

Tex (2) d Mich (26) 3-2
Ore (9) d PSU (1) 3-1

Championship (1-0)

Tex (2) d Ore (9) 3-0

The CACOD also did well in predicting the 2011 tournament.

Wednesday, December 12, 2012

Preview of the NCAA Women's Final Four

The NCAA women's Final Four begins Thursday night, with Michigan facing Texas, followed by Penn State taking on Oregon. To preview the Final Four, I've decided to look back on each team's victory in the Elite Eight. To begin, for each of the victorious teams, let's look at the result of every spike attempted in its respective Elite Eight match (you may click on the following graphics to enlarge them). Box scores for the matches are available at the following links: Penn State-Minnesota, Oregon-Nebraska, Texas-USC, and Michigan-Stanford.

Let's walk through the first case, to illustrate the format. Penn State attempted 156 spikes vs. Minnesota. Sixty-two of these attempts (39.7%) were successful, resulting in kills. Outcomes depicted in black (or dark blue, later) are good. Twenty-five Nittany Lion attacks resulted in hitting errors, 14 (9%) because they were blocked right back onto the Penn State side of the floor for immediate Gopher points and 11 (7%) because Penn State hit the ball out-of-bound or never cleared the net. These bad outcomes for Penn State are depicted in red and purple, respectively. Minnesota dug up 61 (39.1%) of Penn State's spike attempts, and the remaining 8 (5%) are designated as "Other" (e.g., Minnesota blocking the ball back, but Penn State keeping it in play).


Looking at the four horizontal bars, it is clear that Texas (who played USC in its regional final) did the best of any Final Four team at putting the ball away for kills (50.5% of the time, with no other team reaching 40%). There is no way to know for sure whether the four losing teams in the Elite Eight (Minnesota, Nebraska, USC, and Stanford) were equally good defensively, so comparing the hitting statistics of Penn State, Oregon, Texas, and Michigan must be done with caution. Still, it must be noted that USC features Natalie Hagglund, one of the top diggers in the the country (here and here), so it's not like the Longhorns faced a weak opponent in the backcourt.

Oregon had nearly half (46.4%) of its attack attempts dug up by Nebraska, the highest such percent among the Final Four teams. Penn State, Oregon's Thursday opponent, is probably a little better digging team than Nebraska (see Big 10 rankings in statistical categories), so the Ducks may struggle somewhat to put balls away. Penn State (9%) and Michigan (8.7%) exhibited the greatest proneness to getting their spikes blocked.

That Michigan took 173 swings against Stanford shows what a grind-it-out team the Wolverines are. To control for match length, let's note that there were 180 total points in the match (20-25, 25-20, 25-20, 25-20). The Wolverines thus took nearly one hitting attempt for each point played (173/180 = .96). Because many rallies don't have any spike attempts (e.g., aces, free balls), Michigan would thus have taken multiple swings on many plays. The swings/total points ratios for the other teams are as follows:
  • Oregon, 151 swings/172 total points (15-25, 25-22, 25-18, 25-17), ratio = .88
  • Penn State, 156 swings/181 points (25-19, 19-25, 26-24, 25-18), ratio = .86.
  • Texas, 99 swings/130 points (25-19, 25-22, 25-14), ratio = .76.
As seen, none of the other Final Four teams played as swing-intensive a match in the Elite Eight as Michigan. By comparison, Texas hardly tired out its arms at all.

Next, let's look at how the Final Four teams did defensively, focusing on how all of the opponents' spike attempts turned out.


Penn State was best at minimizing the percent of opponent spike attempts that yielded kills, as only 49 (31%) of Minnesota's swings bore immediate fruit (remember, red is bad, so the bigger the red bands, the worse the defense). Texas allowed 38.3% of USC's swings to go for kills, in part because the Longhorns dug a relatively small percent (42.1) of Trojan attempts.

Whether tomorrow night's matches will follow the scripts suggested by the above analyses -- Michigan trying to keep the ball alive on Texas's big swings off the high outside sets and the Wolverines scrapping for points on offense, and Penn State likewise digging up Oregon's attacks -- remains to be seen.  If nothing else, I hope these analyses provide viewers with something to think about during the matches.

Saturday, December 8, 2012

Favorites March On in Friday's NCAA Women's Sweet 16

A tournament in which favored teams overwhelmingly prevail is known, via an expression from horse racing, as following the "chalk." This year's NCAA women's competition is definitely looking like a chalk tournament, as all but one of the eight remaining teams after last night's Sweet 16 round is a top-eight seed. Today's match-ups thus include the following (see bracket for starting times):

No. 1 Penn State vs. No. 8 Minnesota

This match does not look to be all that competitive, at least on paper, as the Nittany Lions took both matches from the Gophers during Big 10 conference play. The first match, in Minneapolis, was a 25-23, 25-8, 25-20 Penn State rout, as the Lions outhit the Gophers .404-.098. The second match, in State College, was closer, but still decisive for Penn State, 25-21, 25-19, 23-25, 25-21.

If one delves further into the statistics of the second match, however, there are some bright spots for the Gophers. Minnesota actually outhit (.207-.204) and outblocked (16-9) Penn State. The Nittany Lions' advantages seemed to come from two other areas. Penn State dug 72 of Minnesota's 121 non-error spike attempts (59.5%), whereas the Gophers dug only 49 of the Lions' 125 non-error attacks (39.2%). Also, Penn State's balance of service aces (11) and errors (12), though negative, was nevertheless more favorable than Minnesota's (5 and 10).

Tonight's rematch features a great coaching match-up, with Penn State's veteran mentor Russ Rose going against new Minnesota coach Hugh McCutcheon, of Olympic coaching fame. McCutcheon definitely has Minnesota on the right track after a tough stretch in early November. Since losing both matches November 9-10 on a swing through Michigan State and Michigan, the Gophers have won seven in a row. The most notable wins during this streak include a home conference match against Nebraska and last night's tight four-game win vs. Big 10 rival Purdue on the Boilermakers' home court (game-by-game log). As shown in the following chart (on which you can click to enlarge), some hot hitting appears to be fueling the Gophers' resurgence.


Yesterday's Minneapolis Star Tribune had a feature article on  middle blocker Dana Knudsen and setter Alexandra Palmer, who both transferred from Santa Clara to join the Gophers this season. Knudsen's hitting, as shown above, has consistently been around .400 of late, with the obvious exception of last night's Purdue match. Fellow middle Tori Dixon has also been pummeling the ball.

The Penn State-Minnesota contest is the only one of today's four matches that can really be said to be taking place on a neutral court, as Purdue is hosting this regional.

No. 2 Stanford vs. unseeded Michigan

Tonight represents the third NCAA-tournament meeting between the Cardinal and Wolverines in four years, with Michigan winning on Stanford's home court in 2011 and 2009. The location for tonight's match is slightly different, Berkeley instead of Palo Alto. The way Stanford is currently playing, Michigan will obviously have a tall order this time.

The Cardinal got a big hitting performance from frosh outside hitter Jordan Burgess (16 kills and only 3 errors on 29 attempts, for a .448 percentage) in sweeping Iowa State last night. Fellow frosh outside Brittany Howard didn't do too badly either (8-0-27, .296). The strong hitting of Burgess and Howard will likely prevent opponents from focusing their block too heavily on Stanford's middle hitters, Carly Wopat (.250 last night) and Inky Ajanaku (yet another frosh; .312 last night). Hitting diagrams I compiled on Stanford earlier this season are available here and here.

Up until last night's win over conference rival Michigan State in three, Michigan had recently been riding the improved hitting of OH Molly Toon. Last night, however, Toon was off-key with a -.048 hitting percentage. MB Jennifer Cross, who has arguably been the Wolverines' steadiest hitter this season, came up big last night, ripping the Spartans for a .500 percentage (12-1-22). Earlier this week, Michigan coach Mark Rosen appeared on Internet radio's "The Net Live" (see link in right-hand column for archives of the show). He characterized Lexi Erwin as a workhorse type of hitter, who is not a kill machine, but produces well over the long haul. Erwin fit exactly that profile last night, hitting .234 on a match-leading 47 attempts.

No. 3 Texas vs. No. 6 USC

The conventional wisdom on this match between the host Longhorns and visiting Trojans, as discussed on The Net Live and elsewhere, is two-fold:
  • Can USC's blockers slow down UT's outside hitting duo of Bailey Webster and Haley Eckerman?
  • Can the Trojans' huge "A-O" middles, Alexis Olgard (6-5) and Alicia Ogoms (6-4), hit well enough to keep the Longhorn block from keying exclusively on 'SC frosh OH Samantha Bricio?
Bricio has led the Trojans in hitting attempts this season with 1,294, outdistancing the next closest player, right-side hitter Katie Fuller, by more than 300 swings. Bricio's season-long .244 hitting percentage may not look spectacular, but is pretty good considering how often she hits. My hitting diagrams on USC are available here and here. The digging of junior libero Natalie Hagglund has also been a major part of the Trojans' success this season.

In addition to Eckerman, recently named Big 12 Player of the Year, and Webster, another Texas stalwart is MB Khat Bell, who suffered a season-ending knee injury last year. Longhorn coach Jerritt Elliott has been resting Bell periodically this season, presumably to avoid re-aggravating the knee, so she should be in good shape for tonight.

No. 4 Nebraska vs. No. 5 Oregon

Finally, we have Oregon taking on Nebraska in Omaha. Needless to say, the Cornhuskers appear to have recovered from a mid-season slump, last night sweeping a Washington squad that was ranked No. 2 in the nation earlier this season and owned wins over USC, UCLA, and Oregon. Scores were 25-14, 25-21, 25-23.

Morgan Broekhuis (9-1-18, .444) and Hannah Werth (9-3-20, .300) led the Huskers' hitting.  Washington had nothing going on offensively, hitting no better than .178 in any of the games. OH Krista Vansant, the Huskies' go-to gal, registered a .242 hitting night (11-3-33). Washington's 9 service errors (to only a pair of aces) didn't help, either. Blocking was a strong suit for the Huskies all season and, indeed, UW outdid Nebraska in this area, 11-4.

Oregon stopped BYU in what again might be called a close, but decisive match, 25-23, 25-21, 22-25, 25-12. According to the linked game article, the Ducks' Liz Brenner "hit .417 - her 11th +.400 total of the season - and added 13 digs for her seventh double-double." Ariana Williams (13-3-23, .435) and Alaina Bergsma (17-4-43, .302) also paced the Quack Attack, which generated a .333 team hitting percentage.

BYU had come out fourth (behind only Penn State, Texas, and Stanford) on my Conference-Adjusted Combined Offensive-Defensive (CACOD) ranking at the end of the season, so I thought an upset over Oregon might be possible. However, the Ducks were too strong.

Sunday, December 2, 2012

NCAA Women's Tourney -- the First Weekend

The Big 10 (which actually has 12 schools) and Pac 12 conferences each had seven teams in this year's NCAA women's tournament. At this stage, with two rounds complete after the first weekend, the Big 10 is looking a bit stronger than the Pac 12. The former has lost only one team (Ohio State), whereas the latter has lost three (No. 7-seed and defending national champion UCLA, Cal, and Arizona State).

Many of the top teams from the two conferences  -- No. 1-seed Penn State and No. 4 Nebraska of the Big 10; and No. 2 Stanford, No. 5 Oregon, and No. 6 USC of the Pac 12 -- made it through to next weekend's Sweet 16 without having lost as much as a single game (set). Other teams faced tougher competition and thus struggled to varying degrees to advance. From the Big 10:
  • No. 8 Minnesota dropped the first set of its second-round match against Creighton, before taking the next three (20-25, 25-17, 25-23, 25-17). The Gophers hit .314 as a team against the Blue Jays, with five Minnesota players hitting .250 or higher on at least 18 attempts each (Dana Knudsen, .500; Tori Dixon, .360; Ashley Wittman, .286; Daly Santana, .280; and Katherine Harms, .258).
  • Next up for Minnesota will be Purdue, which upset No. 9 Florida State in five on the Seminoles' home court. The Boilermakers, who hit .266 as a team vs. FSU, featured three players who exceeded .400 on at least 15 swings each (Rachel Davis, .467; Anna Drewry, .421; and Kierra Jones, .421). Purdue also heavily outblocked FSU, 17-7 in total team blocks. The Minnesota-Purdue match will be on the Boilermakers' home court, a predetermined regional site. Minnesota beat Purdue 3-1 in Minneapolis in the teams' only regular-season meeting.
  • Michigan State is the team who beat UCLA, on the Bruins' home court, no less. UCLA's Tabi Love hit .344 against the Spartans (14 kills and 3 errors on 32 attempts), which according to a previous analysis, should have put the Bruins in a strong position to win. However, Love took only 22.5% of UCLA's total swings (32/142). Looking back at roughly the past month, Love regularly took at least 30-35% of the Bruins' hitting attempts, and sometimes as many as 40-45% of them (in UCLA's October 28 win over Washington, Love took 71 of the Bruins' 157 attempts, which is 45%). With three Spartans reaching attack percentages around .300 (Lauren Wicinski, .294 with 51 attempts; Alexis Mathews, .312; and Taylor Galloway, .310), MSU outhit UCLA, .293-.261. (Wicinski is a transfer from Northern Illinois, whose hitting statistics I analyzed last year.)
  • In another all-Big 10 Sweet 16 match-up, Michigan State will face Michigan in Berkeley, California. The Wolverines escaped with a five-set win over Tennessee in the first round after leading 2-0 in games, then upset No. 10 Louisville in four, on the Cardinals' home court. The hitting star for Michigan has been outside hitter Molly Toon. You might say that most of the regular season was a "tune-up" for Toon, as she (and some of her teammates) didn't start hitting well until fairly late in the conference schedule. Toon's hitting percentages in her last four matches have been .519 at Michigan State and .542 at Ohio State to close Big 10 play, and then .370 and .306 against Tennessee and Louisville, respectively. Michigan and MSU split their two conference matches, with each team winning on the road (box score for match at Ann Arbor).
Besides Stanford, Oregon, and USC, the additional remaining Pac 12 team is No. 13 Washington. The Huskies received a tough second-round challenge from Hawai'i, eking out a 27-25 Game-4 win to stay alive (after the Rainbow Wahine had held match point at 25-24) and then prevailing 15-11 in the fifth. Washington faces a tall task in its next match, playing No. 4 Nebraska in Omaha, the Cornhuskers' home away from their Lincoln home. Against Hawai'i, star Husky hitter Krista Vansant (.297) received support from teammates Cassie Strickland (.312), Kaleigh Nelson (.310), and Kylin Munoz (.289), with all four of these players taking at least 29 swings each.

The only top-10 seed not discussed thus far is, of course, No. 3 Texas from the Big 12. In the second round, the Longhorns faced former conference rival Texas A&M (now of the SEC) and won in four. In vanquishing the Aggies, UT hit a spectacular .389 as a team, led by Bailey Webster (.556), Khat Bell (.421), and Haley Eckerman (.342), with each taking at least 19 swings.

An updated bracket is available here.

Tuesday, November 27, 2012

Ranking the 64 NCAA Women's Teams on the Conference-Adjusted Combined Offensive-Defensive (CACOD) Metric

With the NCAA Division I women's volleyball tournament scheduled to begin play on Thursday, I am unveiling my second annual ranking of the tournament teams on the Conference-Adjusted Combined Offensive-Defensive (CACOD) metric. Though the CACOD is extremely simple to calculate (see below), it held its own with the more established volleyball ranking systems (e.g., Pablo, RPI, Rich Kern) in predicting match outcomes of last year's women's NCAA tournament.

In fact, only three quantities go into the CACOD formula: a team's hitting percentage for the entire season, the hitting percentage the team allowed its opposition to achive (cumulatively) on the season, and a conference-difficulty factor that I determine. I wrote last year about hitting percentage being "a great singular statistic for incorporating many aspects of the game." As I elaborated:

If you hit well (not just keep the ball in play, but get kills), your (individual or team) hitting percentage goes up. An attack kept in play by the other team hurts, as does a hitting error (spiking the ball out of bounds or getting stuff-blocked for an opponent's point). In order to hit well, a team must pass and set well. If you block or dig your opponent's spike attempts, that drives down the opponent's hitting percentage.

Another reason, I suspect, that the CACOD appears to work well is the sheer volume of data that goes into determining hitting percentages. A typical team might take (and have its opponents cumulatively take) from 3,500 to 4,500 swings in a regular season. The formula for the CACOD is simply:


A more in-depth explanation of my ranking scheme is available from a year ago's posting, when I introduced the system. My conference-difficulty factors are as follows:

Factor
Conferences
1.25
Big 10, Pac 12
1.20
Big 12
1.10
ACC
1.00
SEC, Big East*, Atlantic 10, Mid America, Missouri Valley,
West Coast, Big West, Mountain West, Western Athletic
(WAC), Conference USA 
0.75
All Others

*The American Athletic Conference, a spin-off from the Big East, will have a factor of 1.00.

The idea behind the conference-difficulty weighting factor is that, if a team did well on the two primary measures (hitting at a high percentage and keeping the opponents' hitting percentage low) in a tough conference, it should receive some "extra credit." Conversely, if a team did well in a relatively weak conference, its statistics should be discounted somewhat.

This year's factor weights (above) are very similar to last season's, except for two changes. I lowered the Big 12 slightly, from 1.25 to 1.20, as this year's version of the conference seemed a little down from last year (with Texas A&M having departed and a not-ready-for-prime-time West Virginia squad moving in). Also, I raised the ACC from 1.00 to 1.10, in light of some recent NCAA-tourney success (Florida State making the Final Four a year ago and the Elite Eight in 2009; and Duke making the Elite Eight in 2010).

Here are the resulting rankings (see "adjusted ratio" in the right-most column). In any match, whichever team has the higher CACOD ranking would be expected to win, under my system. You may click on the graphics to enlarge them (note that the rankings appear in three parts).


Whereas my ranking of Penn State, Texas, and Stanford in the top three closely matches the actual tournament seedings, the CACOD offers some surprises. Whereas BYU is seeded 12th, for example, I have the Cougars as the fourth-best team in the field. Whereas Florida is seeded 14th, I have the Gators seventh.

Was the CACOD just lucky last year or will it be a successful predictor two years in a row? We'll have a pretty good idea after the next three weekends of tournament play!

Friday, November 23, 2012

Bruin OH's Kidder and Love Play Regular-Season Finale as Trojans Visit UCLA

Defending NCAA champion UCLA hosts USC in the Bruins' regular-season finale tonight, marking the final pre-tournament home appearance for UCLA seniors Rachael Kidder, Tabi Love, and Bojana Todorovic. Outside hitters Kidder and Love have been the mainstays of the UCLA offense. Accordingly, I decided to examine the Bruins' win-loss records this season when Kidder alone, Love alone, both of them, or neither of them had strong hitting nights.

I chose a .300 hitting percentage to define "strong" hitting. Volleyball announcers often make an analogy to baseball hitting, saying that a .300 average in either sport is a sign of success. Also, using .300 as the dividing line breaks UCLA's 28 matches into mostly equal-sized groups. My analysis is summarized in the following graph, on which you can click to enlarge.


The blue bar shows that when Kidder and Love both hit .300 or better in the same match, the Bruins are a perfect 8-0 (1.000 winning percentage). The only problem is that none of these matches were against elite opponents in the Pac 12 (Stanford, USC, Washington, or Oregon). The success in these matches of Kidder, Love, and the team as a whole may thus reflect relatively weak opposition.

The orange-yellow bar tells us that the Bruins were 7-1 (.875) when Love (but not Kidder) hit in the .300s or above. These matches include a win at Hawai'i and a narrow loss at Nebraska.

The pale-yellow bar reveals that when Kidder (but not Love) reached or exceeded .300, UCLA was 3-1 (.750). This batch includes the Bruins' lone win (thus far) against an elite conference opponent (vs. Washington, in Los Angeles) and a narrow loss at Stanford.

Finally, the grey bar shows that when Kidder and Love both hit below .300, the Bruins are 3-5 (.375). More ominously for UCLA, the three wins in this category all came against lesser competition (Colorado, Northeastern, and UC Santa Barbara). The five losses, on the other hand, were all against top Pac 12 opposition on the road.

As the Bruins take on USC tonight and then move on to the NCAA tourney, UCLA's coaches and fans naturally will want Kidder, Love, and all their teammates to hit as effectively as possible. However, last year's Bruin squad showed that stellar hitting percentages from Kidder and Love were not essential for winning a national championship. In UCLA's NCAA final win over Illinois, Love hit .294 (14 kills and 4 errors in 34 attempts) and Kidder hit .127 (20-11-71). The Bruins hit only .218 overall, but held the Illini to a .215 hitting percentage.

Saturday, November 17, 2012

Wild Weekend in the Pac 12

An amazing finish in the Oregon at Washington match and a resurgence by USC against the northern California schools are the big stories in this weekend's Pac-12 play.

The Huskies fought off no fewer than 14 match points to defeat the Ducks, 26-24, 16-25, 21-25, 32-30, 25-23. Keeping in mind that fifth games are to 15 points, we see how deeply into overtime the decisive set went. Two of the match points were in Game 4 and 12 were in Game 5. As the linked article notes, "Making the run all the more impressive was that it came without UW's offensive leader, sophomore Krista Vansant, who landed awkwardly and suffered what appears to be a sprained ankle early in the fourth set, and did not return to the match."

Several players were able to maintain hitting percentages of .300 or better over a large number of attempts (box score). For Oregon, they included Liz Brenner (.410; 22 kills and 6 errors on 39 attempts) and Alaina Bergsma (.302; 31-12-63). For Washington, they included Cassie Strickland (.394; 14-1-33), Kylin Munoz (.342; 17-4-38), and Gabbi Parker (.308; 9-1-26).

A Husky forte all season has been the block and last night's match was no exception, with U-Dub exceeding Oregon in total team blocks, 19-6. The Ducks dominated digging, however, 83-54.

***

Down in Los Angeles, USC handed Stanford its first conference loss, 25-19, 25-20, 27-29, 25-22, on Thursday night. The Trojans then followed up on Friday with a five-set victory over Cal, 23-25, 25-21, 18-25, 29-27, 15-11.

As the above-linked game article from the Cardinal-Trojan match-up points out, "Neither team would let the ball drop as USC recorded a season-high 112 digs and Stanford had 117. Junior libero Natalie Hagglund had the most impressive night of all as she etched her name into the Trojan record books with a career-high 44 digs."

Based on the Stanford-USC box score, I created the following pie-chart (on which you may click to enlarge) to show what happened to each of Stanford's 203 spike attempts on the evening.


What we see is that the Trojans dug up 55.2% of Stanford's total spike attempts (112/203), and 62.6% of the Cardinal's non-error attacks (112/179). The metric of non-error attacks is useful because the defense cannot be expected to dig opposing spike attempts that are blocked at the net or hit out-of-bounds. Not surprisingly given the above data, Stanford had a poor night in terms of hitting percentage, registering a .187. (The figure in the pie-chart of 17 balls hit out-of-bounds by the Cardinal comes from subtracting the 7 USC blocks from Stanford's total of 24 hitting errors; miscellaneous would include balls blocked back over the net by USC that Stanford was able to keep in play, for example.) 

USC's digging two nights ago against Stanford represents a big improvement over some early-season matches. As I wrote about in this late-September posting, the Trojans had dug only 37% of Oregon's non-error attacks and 46% of UCLA's in a pair of key matches at that point in the season. In the first USC-Stanford match of the season (October 10), a 3-0 Cardinal sweep, the Trojans dug only 43% of Stanford's non-error attacks (39/[100-9]).

USC's main offensive weapon, frosh outside hitter Samantha Bricio, also improved her performance from the first (-.043; 10-12-47) to the second (.226; 19-5-62) Stanford match. Also, in the second match, Trojan middle blockers Alicia Ogoms (.471; 8-0-17) and Alexis Olgard (.444; 12-0-27) came through with big hitting nights.

***

Stanford rebounded to defeat UCLA in four games (25-22, 25-18, 15-25, 27-25) Friday night, as the renovated Pauley Pavilion was opened for volleyball. The Cardinal received strong hitting performances from Inky Ajanaku (.412; 10-3-17), Rachel Williams (.400; 16-4-30), and Carly Wopat (.346; 11-2-26). One-half of UCLA's outside-hitting duo, Rachael Kidder, hit well (.362; 21-4-47), but the other half, Tabi Love, had a tough night (.038; 10-8-52).

Monday, November 12, 2012

Michigan Hitting Attack Comes Alive

For most of this season, I haven't had much to write about my graduate-school alma mater, the University of Michigan. Over their last five matches, however, the Wolverines have been playing their best volleyball of the season. They are 5-0 during this stretch, including wins over then-No. 4 Nebraska and then-No. 10 Minnesota (game-by-game log).

Michigan has greatly elevated its hitting performance during these matches, as shown in the following graph (on which you can click to enlarge). The graph depicts the hitting percentages for four leading Wolverine hitters (different shades and styles of blue), and the team as a whole (yellow), in all of the team's conference matches to date.


The first thing to notice is that, until the recent hot streak (indicated by the red arrow), Michigan as a team had hit at or below .200 in most of its matches, a fairly anemic level. In its five most recent matches, in contrast, Michigan's hitting percentages have ranged from .298 to .460. Even with their much-improved offensive performance of late, the Wolverines are still hitting only .234 in Big 10 play as of this writing, ranking them eighth in the conference in team hitting percentage.

Junior middle blocker Jennifer Cross (dashed dark-blue line) has performed steadily at a high level, recording a higher hitting percentage than the team as a whole in nearly all the Wolverines' conference matches. Senior right-side hitter Claire McElheny (dashed light-blue line) has been up and down all season. However, lately she's been entirely up, hitting .571 (9 kills with 1 error on 14 attempts) vs. Iowa, .522 (14-2-23) vs. Wisconsin, and .900 (9-0-10) vs. Minnesota.

Lexi Erwin is far and away the Wolverines' most frequent hitter, with her 627 total attempts to date in conference play exceeding the next closest player, Molly Toon, by 268 swings. Both are junior outside (left-side) hitters. Erwin (solid dark-blue line) was somewhat inconsistent early in Big 10 play, but has been mostly on an upswing in the second half of the conference season. Toon (solid light-blue line) struggled for most of the conference schedule, but has improved her hitting output in the last five matches.

Michigan got hot at the end of last season and made a nice run in the NCAA tournament, sparked by then-senior OH Alex Hunt. It apparently has taken this year's Wolverine squad some time to adjust to Hunt's absence, but the team's recent offensive statistics look promising. The bulk of Michigan's recent hot streak has come at home. For the final two weekends of the regular season, the Wolverines play entirely on the road, at Northwestern, Illinois, Michigan State, and Ohio State.

Friday, November 9, 2012

Nebraska Slumping of Late

Perennial power Nebraska heads into this weekend's homestand vs. Indiana (tonight) and Purdue (tomorrow) with three losses in its last four matches. After dropping their Big 10 opener at Penn State -- certainly no crime -- the Cornhuskers won nine straight. The next time out, seemingly out of nowhere, Nebraska fell at home to Ohio State in four games, before rebounding to beat then-No. 1 Penn State in five. A winless trip to Michigan and Michigan State followed, with the loss to the Wolverines particularly jarring because the Huskers had led two games to none.

The Huskers' season to date is nicely encapsulated in this weekend's match notes from the Nebraska athletic department. Given the importance of hitting percentage in teams' success, I decided to plot Nebraska's hitting percentages for all of its conference matches so far this season, for the team as a whole and for the five players who take the most swings (you may click on the following graphic to enlarge it). 


During the recent slump, the Huskers as a team, and Gina Mancuso, Hannah Werth, and Hayley Thramer, individually, have seen a sharp decline in their hitting percentages (highlighted in yellow). Frosh middle blocker Meghan Haggerty has been erratic throughout the Big 10 season, recording some big highs (.700 at home vs. MSU, .778 at Illinois) and lows (-.111 at home vs. Wisconsin) in her hitting percentages.

In fact, Mancuso has been an almost perfect barometer of how the team is doing. When she's hit well, so have the Huskers, and when she's hit poorly, the team has, as well. To simplify things, I've removed the other players from the above graph and created a new plot below. One can see that, other than the Wisconsin match, in which Mancuso exploded for a .583 performance, her hitting percentages (dotted red line) have tracked extremely closely with the team's hitting percentages (black line). In most Big 10 matches, Mancuso has taken from 20-30% of the Huskers' swings.


Saturday, November 3, 2012

Upset Friday!

Last night saw four major upsets, three of which were in the Pac 12. All four of the victorious teams were unranked in the latest AVCA national poll. No. 2 Oregon lost at home in five to Cal, No. 4 Nebraska squandered a two-games-to-none lead and fell at Michigan, No. 5 UCLA was swept at Arizona, and No. 6 USC was swept at Arizona State.

UCLA really seems to have a hard time with Arizona, for whatever reason. Even though the Bruins ultimately won last year's NCAA title, they lost both 2011 regular-season matches to the Wildcats. This year, the teams split, with UCLA winning at home on October 7, before last night's Arizona win. In order to get an idea of what might be going on, I've created the following table of key statistics for the last four matches between the Bruins and Wildcats (box-score links are at the top of each column; H% = hitting percentage). My usual warnings about concluding too much from small samples apply, however. 


2011@Ariz 2011@UCLA 2012@UCLA 2012@Ariz
UCLA Team H% .256 .189 .333 .143
Kidder H% .290 .265 .333 .148
Love H% .167 .050 .591 .133
UCLA Side-Out% 62% 62% 68% 54%
Arizona Team H% .239 .259 .258 .288
Arizobal H% .263 DNP .267 .312
Kingdon H% .200 .061 .278 .219
Arizona Side-Out% 57% 70% 55% 66%
Winner Ariz 3-2 Ariz 3-0 UCLA 3-0 Ariz 3-0

Arizona seems to be the steadier team in these matches on hitting percentage, staying within a range of .239 to .288, whereas UCLA's been all over the place from .143 to .333. The attacking prowess of Bruin outside hitter Tabi Love appears to be crucial; in UCLA's one win, Love hit .591 (13 kills without an error on 22 attempts), whereas in the other matches, she's hit .167 and below.

Sophomore outside hitters Taylor Arizobal and Madison Kingdon were steady for the Wildcats in this year's matches against the Bruins. Last year, U of A had seniors Cursty Jackson and Courtney Karst to handle a lot of the hitting load and let Arizobal and Kingdon come along gradually. For example, in Arizona's second 2011 match against UCLA, Jackson hit .304 and Karst, .393, to key the Wildcat sweep.

I don't know that UCLA's side-out rates are that diagnostic, other than the 54% performance associated with last night's loss. In the teams' first 2011 match, the Bruins had the better side-out rate despite losing the match (thanks to an 80-31% side-out advantage in Game 2, which the Bruins won 25-10). Also, when the Wildcats have sided-out at 66% or better for a full match, the Bruins haven't been able to win even a game.

***

Nebraska has gone through an unusual stretch recently. Last weekend, playing at home, the Huskers lost to Ohio State, but bounced back to beat No. 1 Penn State. Nebraska, of course, lost last night to Michigan and now is playing Michigan State. I will elaborate upon  Nebraska's recent performance, as well as that of USC and Oregon, in future postings.

Thursday, November 1, 2012

Hitting Charts for Washington vs. USC/UCLA

This past weekend, the University of Washington women went down to Los Angeles where they lost matches to USC (in five games) and UCLA (in four). Both matches were televised on the Pac 12 Network, so I was able to compile hitting charts for selected games from both matches. You may click on the following graphics to enlarge them.

My notation and terminology are evolving as I create these diagrams. One recent development is that, if you see "IP" only, it means a hit attempt was kept in play due to being dug, whereas IP accompanied by "b reboot" means that the hit attempt was blocked back to the attacking team, which had to start over with a new attack. As I have noted previously, I'm doing my best to identify the player who took each spike attempt, but sometimes I'm only able to identify the team of the attacker. First, we have Game 4 of the USC-Washington match...


Next, we have two diagrams for Games 3 and 4, respectively, of the UCLA-Washington contest...


One trend apparent in the above charts (albeit with small sample sizes) is that Washington appears to be moving around its main offensive weapon, outside hitter Krista Vansant, from her usual location on the left-hand side of the front row, so she can take occasional swings from the right side or even the middle, on a combination play (see the quote from the TV announcers in Game 3 of the UCLA match).

Against USC, Vansant took 80 of the Huskies' 203 attemps (39.4%), hitting .150. She doubled her hitting percentage against UCLA, reaching .305 on 59 attempts. You can compare the Huskies' hitting attempts above vs. USC and UCLA to an earlier Washington match vs. Stanford.

From the one game above featuring USC, the main pattern I'm able to glean for the Trojans is nothing earth-shattering. Specifically, they frequently called the number of frosh outside hitter Samantha Bricio. For the match as a whole, she took 74 of USC's 202 swings (36.6%), hitting .243 (box score).

In UCLA's match against Washington, the Bruins went heavily to Tabi Love on the outside. In addition, UCLA middle blockers Zoe Nightingale and Mariana Aquino hit with great proficiency, both in the depicted games and for the match as a whole; their final hitting percentages were .421 and .500, respectively (box score).

I probably won't be charting many more Pac 12 matches this season. I had been receiving the Pac 12 Network on my satellite package, which is a little unusual because I live in Texas. The Pac 12 Network no longer appears on my television, however. Perhaps it appeared during October as a free preview to entice viewers outside the Pac 12's "footprint" to subscribe.  

Wednesday, October 24, 2012

Hitting Allocation Graph from Last Friday's Stanford-Washington Match

Below is a hitting allocation chart I made for Game 2 of last Friday night's Stanford-Washington match. The Cardinal took both this particular game/set and the match as a whole, 10-25, 28-26, 10-25, 26-24, 15-7. The chart shows which players took hitting attempts off of serve-receipt, from where on the court, at what angle, and with what result. An  introduction to the notation is available from this earlier posting in which I introduced the chart. One new piece of terminology today is that an offensive "reboot" is when a spike attempt is blocked back to the attacking team, which then starts over. For this chart, I tried harder to catch the names of the specific players taking each swing, but I was not always successful. You may click on the graphic to enlarge it.


I don't think there are really any big surprises here. Stanford went heavily to middle-blocker Carly Wopat, both in the middle and on the slide play to the right, and she produced several kills. Washington often called the number of outside hitter Krista Vansant, with mixed results.

The Huskies go down to Los Angeles this weekend to face USC (Friday) and UCLA (Sunday) in a pair of marquee match-ups.

Friday, October 19, 2012

Passing Well and Setting the Middle: The Texas Tech Internal Data

Today, for my second analysis using Texas Tech internal team data, I look at the relationship between quality of the team's passes on serve receipt, on the one hand, and the location and success of the resulting hit attempts, on the other. Again, my thanks to head coach Don Flora and assistant Jojit Coronel for their willingness to share the data and answer any questions I have. (Here's a link to my first analysis of the Texas Tech data, which focused on side-out rates in different rotations.)

The better the pass a team can make on serve receipt, the easier it will be for the setter to get to the ball and, hence, the better should be the set. A good set should then increase the hitter's likelihood of achieving a kill. A further objective for many teams is to set the ball for the middle hitter, to quicken the offense. Other common plays involve high-arching sets to the outside, which give the other team time to get their blockers in place.

In general, teams collect more specific or "micro-level" data than what are available in published box scores. One form of micro data is an evaluative rating of each pass, made by a coach or other observer who reviews video of a match. On serve-receipt, pass quality can range from 0 (being aced) to 3 (an excellent pass that gives the setter the full range of options for feeding a hitter in an advantageous position).

In the following graph (on which you can click to enlarge), the left-hand column has headings for pass quality 3, 2, and 1. For each level of pass quality, you can read horizontally to see Texas Tech's distribution of hit attempts taken from the outside (left), middle, and right. (The hit attempts were summed for the Red Raiders' first eight matches of the season.) For example, on passes of quality 3, Texas Tech went to the left 11.6% of the time, to the middle 68.8% of the time, and to the right 19.5% of the time.


As Coach Coronel clarified for me, the classification of left, middle, and right refers to the location where the attack took place, not to a player's position as listed on the roster. Thus, if an outside (left) hitter migrated into the middle to attack a ball, the play would be designated as a middle attack. Another example is a slide play, in which a middle hitter runs toward the right antenna to elude the opposing middle blocker, and hits from there.

The graph confirms that Texas Tech was incrementally more likely to set the middle with increasing quality of pass: roughly 10% of the time on a 1-quality pass, 43% of the time on a 2-quality pass, and 69% of the time on a 3-quality pass. For those with some statistical background, a 3 X 3 chi-square test on the raw frequencies indicated that the distributions of spike attempts into left, middle, and right were significantly different for the varying levels of pass quality (X2 = 83.6, p < .001).

Also included in the information I received were Texas Tech's hitting percentages from each of the Red Raiders' first eight matches, broken down by pass quality on serve-receipt. (The cryptic column headings, such as "hp_psql1," refer to hitting percentage pass quality 1 or whatever number.) These results are presented in the following table.


When Texas Tech's initial pass of the opponent's serve was of the lowest quality (1), the Red Raiders' average hitting percentage across the eight matches was essentially zero. In four of the matches, the team's hitting percentage was negative, indicating more hitting errors than kills. One thing that prevented the team's average hitting percentage on poor-quality passes from ending up markedly negative was a positive .75 hitting percentage on quality-1 passes vs. Binghamton; however, the .75 value was based on only four hitting attempts.

On medium-quality passes (2), the Red Raiders averaged a .232 hitting percentage, and on their best passes (3), their hitting percentage averaged .326. Analysis of Variance (ANOVA) showed that the linear trend of increasing average hitting percentage with better passing was statistically significant (F = 8.70, p < .05).

Some volleyball analysts offer the analogy between volleyball hitting percentages and baseball batting averages, arguing that .300 signifies high-quality performance in either sport. If one accepts this notion, then Texas Tech seemingly needs to receive serve with a passing proficiency close to 3, in order to have a good chance of hitting .300.

It should be noted that Texas Tech won all eight of the matches that formed the basis for the present analyses. Big 12 conference play has proven to be a more challenging proposition. I hope to be able to analyze statistics from conference play at some time in the future.

Tuesday, October 16, 2012

New Kind of Hitting Allocation Charts

This past weekend featured as much televised women's collegiate volleyball as I can remember seeing over a similar period. A big reason is the new Pac 12 Network and its extensive coverage of volleyball, but ESPN 2 and ESPN-U also played a part. With so many matches available, I decided to test a new type of chart to track teams' hitting allocations off of serve receipt, including the locations and angles of the spike attempts. I did something similar for a UCLA-Texas match in the 2010 NCAA women's tournament, based on video coverage from the Longhorns' website using an "end-zone" camera. Here's a link to that previous analysis.

Traditional television coverage uses a sideline camera (for the most part), however, so I developed a new graphing approach using this perspective. One benefit of mapping the locations and angles of spike attempts is that doing so provides richer information than a typical box score. For example, a box score would list how many attempts, kills, and errors were recorded by a middle-blocker. However, there would be no way to distinguish spikes taken by middle blockers from the actual middle of the front row from those taken on slide plays, on which the middle blocker runs over to the far-right side to evade his or her blocker and attacks from there.

I graphed four different games/sets from this past weekend, from three different matches. Let's take a look first at Game 4 from Stanford's five-game win over UCLA last Friday night (you may click on the graphics to enlarge them).


I think most of the terms should be self-explanatory. Just to clarify a few that may be unclear, "In Play" refers to an attack that remained in play due either to being blocked back to the attacking team, which could then start over, or being dug by the defensive side. All plays refer to hard-hit spike attempts, unless the attack is described as a "Tip." All attacks were categorized according to the location from which the ball was attacked, not necessarily the position with which a given player is identified (e.g., the aforementioned slide attack, which is undertaken by a middle hitter, is listed as emanating from the right-hand side).

As can be seen, the teams showed contrasting approaches. UCLA focused on the "pins" (the right and left antennae at the ends of the net), whereas Stanford stormed the middle. For the Bruins, Tabi Love went to town with cross-court spikes from the left end, drawing the exclamation noted in the chart. Shoring up the right side was Kelly Reeves. For Stanford, Carly Wopat and Inky Ajanaku recorded kills in the middle; it also looked to me like Rachel Williams hit some balls in the middle, but she is officially listed as an outside hitter (I could be wrong).

Before looking at the remaining charts, I want to mention four limitations in these depictions:

1. They only show the attacks launched upon serve-receipt, not any attacks in transition.

2. For the most part, they present only team totals for a given avenue of attack, rather than statistics for individual players. I do have a few exceptions in which individual hitters are identified. However, the speed of the game makes it difficult to identify particular players in many instances.

3. As long as the television broadcasts stuck to sideline views, my charts should be highly accurate. However, when a different angle (e.g., end-zone) was presented, I faced a spatial-rotation challenge to convert the shown angle to the sideline-angle format of the charts.

4. There were a few plays (noted in the fine print) that I just flat-out missed, for example, because I was still writing down the information for one play while the next serve was being struck.

Next, let's look at Game 2 of USC's three-game sweep of Cal across the Bay. The Golden Bears enjoyed success on slide plays featuring Correy Johnson, but little else. USC went several times to outside hitter Samantha Bricio, but the Mexican frosh had difficulty on the evening, hitting only .167 (she also struggled two nights earlier against Stanford, hitting -.043).


Lastly, I looked at two games (1 and 2) from Sunday's Minnesota-Nebraska match. One game may or may not provide a valid microcosm of an entire match, so I decided to look at two games in this instance. The Golden Gophers took the first game, but the Cornhuskers roared back to take the next three.

In Game 1, the Gophers amassed 17 kills, which were relatively evenly distributed among five players: OH Katherine Harms 5, MB Tori Dixon 4, OH Ashley Wittman 3, OH Daly Santana 3, and MB Dana Knudsen 2 (play-by-play sheet). As shown below, eight of those Minnesota kills occurred immediately off of serve-receipt. Five of the eight stemmed from slide plays or quick sets down the middle.


In winning Game 2, Nebraska exhibited a variety of ways to produce kills on serve-receipt: a couple of cross-court spikes from the outside hitters, a couple of slides, a tip here and there. The Huskers were also aided by four Gopher service errors.


In conclusion, I think these charts offer a lot of information at a glance, even with their imperfections (e.g., difficulty in identifying particular players from television broadcasts). If I get a chance, I will try to map the action from watching a match in person. If archived videos are available, analysts can go back to enhance the detail provided in the chart.

Thursday, October 4, 2012

Controversy Over NCAA Rule Change on No. of Subs

On this week's episode of the Internet-radio show The Net Live, a spirited discussion broke out on the merits of this year's new NCAA women's rule expanding the number of substitutions from 12 to 15 per game/set (see link to the archived broadcasts in the right-hand column). Substitution policy clearly has analytic implications, thus making it a worthy topic for VolleyMetrics; I provide no statistics in this write-up.

This July 31 article focusing on the Nebraska program provides a lot of background perspective. A key impetus for the rule change appears to be the opportunity to get more players into matches. In terms of volleyball training, the substitution issue raises questions of player specialization vs. well-roundedness.  As the article notes:

With 15 substitutions, coaches will likely not have to worry about reaching their limit and can take out their top hitters when it is time to rotate to the back row, replacing them with passing and serving specialists...

“There are very few kids that are 6-foot-5 and athletic,” [Nebraska coach John] Cook said. “There are only so many to go around, and the top programs are going to get those. They won't have to worry about training them back row. There will be no equalizer when they have to go to the back row.

Of concern to some is how a greater trend toward specialization at the college level will impact the U.S. Olympic program. According to the article, "International rules allow only six subs per set and only one per set at each position, which means that players with all-around skills are preferred over elite specialists."

Some observers, such as UCLA athletic administrator and Net Live contributor Mike Sondheimer, believe having the number of substitutions at 15 facilitates running a 6-2 (two-setter) offense. Such an offense is potentially advantageous in that, by always having a setter in the back row (guaranteed by placing the two of them three positions apart in the rotation), the team can always have three hitters in the front row. The back-row setter thus runs up into the front row to set, once the ball is served (the only restriction is that a player originating in the back row cannot attack in front of the 10-foot line). In a 5-1 (one-setter) offense, half the time the setter is in the front row, leaving only two hitters.

The potential downside of a 6-2 is that, in addition to one setter always being in the back row, one also is always in the front row, where she or he can hit and block. Setters tend to be shorter than other players, however, potentially limiting their effectiveness as hitters and blockers. Bringing the discussion back to the substitution rule, my interpretation of Sondheimer's statement is the 15 opportunities make it easier to replace an undersized setter when she or he rotates into the front row, with a tall hitter/blocker specialist. 

Tuesday, October 2, 2012

Success of Texas Blocking Line-Ups at Texas Tech

I attended last Saturday afternoon's University of Texas at Texas Tech match. The Longhorns won 3-0, but the Red Raiders were very competitive in two of the games/sets, as reflected in the 25-16, 25-23, 25-22 score. My focus was on the Longhorns' blocking -- how they lined up in their rotations and with which combinations were they able to stuff the Red Raiders for points.

Texas's front lines in their six rotations (A through F), depicted schematically with the players' faces to the net, are shown in the graphic below. You may click on the graphic to enlarge it. The figure pertains only to Game 2, in which the Longhorns achieved 6 of their total 14 team blocks in the match (Texas Tech had only 3 team blocks total in the match). The Texas uniform numbers in the figure correspond to actual players, as follows:
  • 1 Kat Bell (MB, 6-1, soph)
  • 5 Molly McCage (MB, 6-3, frosh)
  • 10 Haley Eckerman (OH, 6-3, soph)
  • 12 Hannah Allison (S, 5-11, junior)
  • 14 Sha'Dare McNeal (RS, 6-1, senior)
  • 23 Bailey Webster (OH, 6-3, junior)


As can be seen, the Longhorns earned two points each on blocking in rotations A, C, and F. The blue arrows illustrate how pairs of players came together to block (i.e., did an outside player move toward the center to join the middle blocker, or did the middle blocker move outside?). As always, I tried to reconcile the notes I took at the match with what was reported in the play-by-play sheet. Due to one discrepancy, I could not pinpoint the location of one block. Recall that blocks are credited in the statistics only when immediately resulting in a point.

Also, as noted in the AVCA PowerPoint on keeping statistics (see links in right-hand column): "...it does NOT matter which player touches the ball – if 2-3 players go up for a block and one player touches it, each receives a block assist." I was nevertheless interested in which player's arm actually blocked the ball. In the figure, therefore, I listed the player first who actually touched the ball, then said "(with)" to refer to the additional player credited with the block (see asterisk in Rotation A as an example).

Obviously, the number of blocks in this exercise is small. However, with data from several matches, coaches could study their opponents' blocking success by rotation and location (left, center, and right) and instruct their teams to hit away from their opponents' advantageous blocking areas.

***

In other weekend action, Washington moved to 13-0 on the season with a 25-23, 26-24, 25-21 victory over USC on Friday night. If a match can be a tight three-game sweep, this was one of them. The box score doesn't leave a lot of clues as to why the match was so close, at least as far as I can tell. The Huskies outperformed the Trojans in hitting (.239-.221), blocking (11-4), and serving for aces (8-1, each team had 12 service errors). 'SC outdug U-Dub 43-29, but that would be reflected in the team hitting percentages (i.e., spiking a ball that is dug increases the hitting team's number of attempts, while depriving it of a kill). The Huskies' Krista Vansant continued her hot hitting, registering a .370 percentage on 12 kills (with only 2 errors) in 27 swings.

Last Saturday's Penn State at Minnesota contest featured a battle of coaching titans. Russ Rose has coached the Nittany Lions to five NCAA titles, whereas new Golden Gophers' coach Hugh McCutcheon has guided medal-winning U.S. teams in the last two Olympiad (the men to gold in 2008 and the women to silver in 2012). Not only that; both teams came in ranked in the top 10 nationally (PSU No. 1 and Minnesota No. 10). Though the match might have looked good on paper, in the end it was a rout, Penn State prevailing 25-23, 25-8, 25-20. In Game 2, the Gophers sided-out at a 29% clip (7-24), which is incredibly low for as good a team as Minnesota. In the same game, the Lions sided-out with 88% proficiency (8-9). For the match overall, Penn State dominated the hitting (.404-.098). The box score can be accessed here.

Friday, September 28, 2012

Breaking Down Wednesday's UCLA-Wash. Thriller

UCLA has shown a flair in this young season for the dramatic, beginning with an opening-weekend loss to Nebraska (15-13 in the fifth). Wednesday night, the Bruins played another epic match, losing in five at Washington as the Huskies won all three of their games by the minimum two-point margin (22-25, 30-28, 19-25, 28-26, 16-14.)

Despite entering the UCLA match undefeated, Washington was largely untested (a match against Purdue being the exception). Now, however, the Huskies have shown that they belong among the nation's elite.

The UCLA-Washington showdown featured a match-within-a-match aspect, namely a battle between the teams' slugging outside hitters. For the Huskies, it was sophomore Krista Vansant going against Bruin seniors Tabi Love and Rachael Kidder.

Based on the play-by-play sheet (which I accessed by going to the Huskies' schedule page and then clicking on the archived Gametracker for the UCLA match), I created the following chart of what I thought were the key statistical indicators (you may click on the chart to enlarge it). All of my tabulations from the Gametracker play-by-play matched the official box score, with the exception that I counted 30 kills for Vansant and the box score on the UW said she had 31. (Attacked balls kept in play are not listed on the play-by-play sheet, hence my focus on kills and errors.)


UCLA likely would have gone up 2-0 in games but for amazing U-Dub performances on two counts. Not only did Vansant record 10 kills with only 1 hitting error; the Huskies also blocked 6 Bruin spike attempts for immediate points (2 on swings by Kidder, 1 on a swing by Love).

Then, despite fifth games being shorter than the previous games (up to 15, instead of 25), Vansant amassed 7 kills (with 2 errors). She ended up hitting .448 on the night. Love, though hitting nearly error-free for most of the match, struggled a bit in Game 4, with 4 errors (3 balls hit astray and 1 attempt blocked). She ended up hitting .266. Kidder was a little more uneven, finishing up at .196. 

The Huskies return to the court tonight, hosting USC.

2023 NCAA Women's Preview

Sixth-four teams are alive at the moment, but it sure looks like Nebraska (28-1) and Wisconsin (26-3) will meet for a third time this season...