This past weekend featured as much televised women's collegiate volleyball as I can remember seeing over a similar period. A big reason is the new Pac 12 Network and its extensive coverage of volleyball, but ESPN 2 and ESPN-U also played a part. With so many matches available, I decided to test a new type of chart to track teams' hitting allocations off of serve receipt, including the locations and angles of the spike attempts. I did something similar for a UCLA-Texas match in the 2010 NCAA women's tournament, based on video coverage from the Longhorns' website using an "end-zone" camera. Here's a link to that previous analysis.
Traditional television coverage uses a sideline camera (for the most part), however, so I developed a new graphing approach using this perspective. One benefit of mapping the locations and angles of spike attempts is that doing so provides richer information than a typical box score. For example, a box score would list how many attempts, kills, and errors were recorded by a middle-blocker. However, there would be no way to distinguish spikes taken by middle blockers from the actual middle of the front row from those taken on slide plays, on which the middle blocker runs over to the far-right side to evade his or her blocker and attacks from there.
I graphed four different games/sets from this past weekend, from three different matches. Let's take a look first at Game 4 from Stanford's five-game win over UCLA last Friday night (you may click on the graphics to enlarge them).
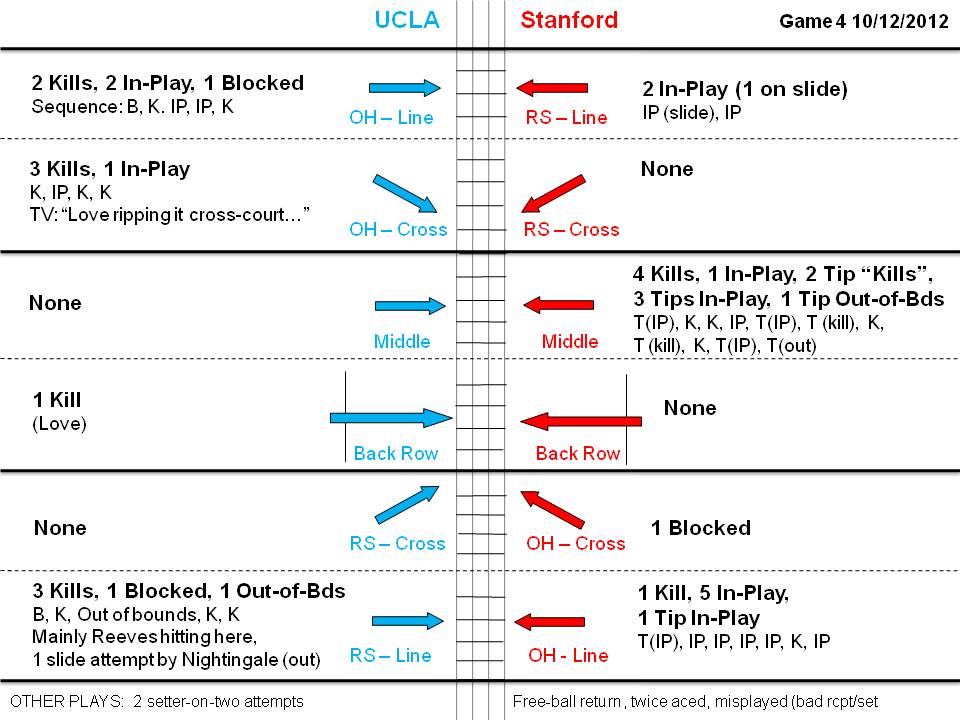
I think most of the terms should be self-explanatory. Just to clarify a few that may be unclear, "In Play"
refers to an attack that remained in play due either to being blocked
back to the attacking team, which could then start over, or being dug by
the defensive side. All plays refer to hard-hit spike attempts, unless
the attack is described as a "Tip." All attacks were categorized
according to the location from which the ball was attacked, not
necessarily the position with which a given player is identified (e.g., the aforementioned
slide attack, which is undertaken by a middle hitter, is listed as
emanating from the right-hand side).
As can be seen, the teams showed contrasting approaches. UCLA focused on the "pins" (the right and left antennae at the ends of the net), whereas Stanford stormed the middle. For the Bruins, Tabi Love went to town with cross-court spikes from the left end, drawing the exclamation noted in the chart. Shoring up the right side was Kelly Reeves. For Stanford, Carly Wopat and Inky Ajanaku recorded kills in the middle; it also looked to me like Rachel Williams hit some balls in the middle, but she is officially listed as an outside hitter (I could be wrong).
Before looking at the remaining charts, I want to mention four limitations in these depictions:
1. They only show the attacks launched upon serve-receipt, not any attacks in transition.
2. For the most part, they present only team totals for a given avenue of attack, rather than statistics for individual players. I do have a few exceptions in which individual hitters are identified. However, the speed of the game makes it difficult to identify particular players in many instances.
3. As long as the television broadcasts stuck to sideline views, my charts should be highly accurate. However, when a different angle (e.g., end-zone) was presented, I faced a spatial-rotation challenge to convert the shown angle to the sideline-angle format of the charts.
4. There were a few plays (noted in the fine print) that I just flat-out missed, for example, because I was still writing down the information for one play while the next serve was being struck.
Next, let's look at Game 2 of USC's three-game sweep of Cal across the Bay. The Golden Bears enjoyed success on slide plays featuring Correy Johnson, but little else. USC went several times to outside hitter Samantha Bricio, but the Mexican frosh had difficulty on the evening, hitting only .167 (she also struggled two nights earlier against Stanford, hitting -.043).
Lastly, I looked at two games (1 and 2) from Sunday's Minnesota-Nebraska match. One game may or may not provide a valid microcosm of an entire match, so I decided to look at two games in this instance. The Golden Gophers took the first game, but the Cornhuskers roared back to take the next three.
In Game 1, the Gophers amassed 17 kills, which were relatively evenly distributed among five players: OH Katherine Harms 5, MB Tori Dixon 4, OH Ashley Wittman 3, OH Daly Santana 3, and MB Dana Knudsen 2 (play-by-play sheet). As shown below, eight of those Minnesota kills occurred immediately off of serve-receipt. Five of the eight stemmed from slide plays or quick sets down the middle.
In winning Game 2, Nebraska exhibited a variety of ways to produce kills on serve-receipt: a couple of cross-court spikes from the outside hitters, a couple of slides, a tip here and there. The Huskers were also aided by four Gopher service errors.
In conclusion, I think these charts offer a lot of information at a glance, even with their imperfections (e.g., difficulty in identifying particular players from television broadcasts). If I get a chance, I will try to map the action from watching a match in person. If archived videos are available, analysts can go back to enhance the detail provided in the chart.
Texas Tech professor Alan Reifman uses statistics and graphic arts to illuminate developments in U.S. collegiate and Olympic volleyball.
Tuesday, October 16, 2012
Thursday, October 4, 2012
Controversy Over NCAA Rule Change on No. of Subs
On this week's episode of the Internet-radio show The Net Live, a spirited discussion broke out on the merits of this year's new NCAA women's rule expanding the number of substitutions from 12 to 15 per game/set (see link to the archived broadcasts in the right-hand column). Substitution policy clearly has analytic implications, thus making it a worthy topic for VolleyMetrics; I provide no statistics in this write-up.
This July 31 article focusing on the Nebraska program provides a lot of background perspective. A key impetus for the rule change appears to be the opportunity to get more players into matches. In terms of volleyball training, the substitution issue raises questions of player specialization vs. well-roundedness. As the article notes:
With 15 substitutions, coaches will likely not have to worry about reaching their limit and can take out their top hitters when it is time to rotate to the back row, replacing them with passing and serving specialists...
“There are very few kids that are 6-foot-5 and athletic,” [Nebraska coach John] Cook said. “There are only so many to go around, and the top programs are going to get those. They won't have to worry about training them back row. There will be no equalizer when they have to go to the back row.
Of concern to some is how a greater trend toward specialization at the college level will impact the U.S. Olympic program. According to the article, "International rules allow only six subs per set and only one per set at each position, which means that players with all-around skills are preferred over elite specialists."
Some observers, such as UCLA athletic administrator and Net Live contributor Mike Sondheimer, believe having the number of substitutions at 15 facilitates running a 6-2 (two-setter) offense. Such an offense is potentially advantageous in that, by always having a setter in the back row (guaranteed by placing the two of them three positions apart in the rotation), the team can always have three hitters in the front row. The back-row setter thus runs up into the front row to set, once the ball is served (the only restriction is that a player originating in the back row cannot attack in front of the 10-foot line). In a 5-1 (one-setter) offense, half the time the setter is in the front row, leaving only two hitters.
The potential downside of a 6-2 is that, in addition to one setter always being in the back row, one also is always in the front row, where she or he can hit and block. Setters tend to be shorter than other players, however, potentially limiting their effectiveness as hitters and blockers. Bringing the discussion back to the substitution rule, my interpretation of Sondheimer's statement is the 15 opportunities make it easier to replace an undersized setter when she or he rotates into the front row, with a tall hitter/blocker specialist.
Tuesday, October 2, 2012
Success of Texas Blocking Line-Ups at Texas Tech
I attended last Saturday afternoon's University of Texas at Texas Tech match. The Longhorns won 3-0, but the Red Raiders were very competitive in two of the games/sets, as reflected in the 25-16, 25-23, 25-22 score. My focus was on the Longhorns' blocking -- how they lined up in their rotations and with which combinations were they able to stuff the Red Raiders for points.
Texas's front lines in their six rotations (A through F), depicted schematically with the players' faces to the net, are shown in the graphic below. You may click on the graphic to enlarge it. The figure pertains only to Game 2, in which the Longhorns achieved 6 of their total 14 team blocks in the match (Texas Tech had only 3 team blocks total in the match). The Texas uniform numbers in the figure correspond to actual players, as follows:
As can be seen, the Longhorns earned two points each on blocking in rotations A, C, and F. The blue arrows illustrate how pairs of players came together to block (i.e., did an outside player move toward the center to join the middle blocker, or did the middle blocker move outside?). As always, I tried to reconcile the notes I took at the match with what was reported in the play-by-play sheet. Due to one discrepancy, I could not pinpoint the location of one block. Recall that blocks are credited in the statistics only when immediately resulting in a point.
Also, as noted in the AVCA PowerPoint on keeping statistics (see links in right-hand column): "...it does NOT matter which player touches the ball – if 2-3 players go up for a block and one player touches it, each receives a block assist." I was nevertheless interested in which player's arm actually blocked the ball. In the figure, therefore, I listed the player first who actually touched the ball, then said "(with)" to refer to the additional player credited with the block (see asterisk in Rotation A as an example).
Obviously, the number of blocks in this exercise is small. However, with data from several matches, coaches could study their opponents' blocking success by rotation and location (left, center, and right) and instruct their teams to hit away from their opponents' advantageous blocking areas.
***
In other weekend action, Washington moved to 13-0 on the season with a 25-23, 26-24, 25-21 victory over USC on Friday night. If a match can be a tight three-game sweep, this was one of them. The box score doesn't leave a lot of clues as to why the match was so close, at least as far as I can tell. The Huskies outperformed the Trojans in hitting (.239-.221), blocking (11-4), and serving for aces (8-1, each team had 12 service errors). 'SC outdug U-Dub 43-29, but that would be reflected in the team hitting percentages (i.e., spiking a ball that is dug increases the hitting team's number of attempts, while depriving it of a kill). The Huskies' Krista Vansant continued her hot hitting, registering a .370 percentage on 12 kills (with only 2 errors) in 27 swings.
Last Saturday's Penn State at Minnesota contest featured a battle of coaching titans. Russ Rose has coached the Nittany Lions to five NCAA titles, whereas new Golden Gophers' coach Hugh McCutcheon has guided medal-winning U.S. teams in the last two Olympiad (the men to gold in 2008 and the women to silver in 2012). Not only that; both teams came in ranked in the top 10 nationally (PSU No. 1 and Minnesota No. 10). Though the match might have looked good on paper, in the end it was a rout, Penn State prevailing 25-23, 25-8, 25-20. In Game 2, the Gophers sided-out at a 29% clip (7-24), which is incredibly low for as good a team as Minnesota. In the same game, the Lions sided-out with 88% proficiency (8-9). For the match overall, Penn State dominated the hitting (.404-.098). The box score can be accessed here.
Texas's front lines in their six rotations (A through F), depicted schematically with the players' faces to the net, are shown in the graphic below. You may click on the graphic to enlarge it. The figure pertains only to Game 2, in which the Longhorns achieved 6 of their total 14 team blocks in the match (Texas Tech had only 3 team blocks total in the match). The Texas uniform numbers in the figure correspond to actual players, as follows:
- 1 Kat Bell (MB, 6-1, soph)
- 5 Molly McCage (MB, 6-3, frosh)
- 10 Haley Eckerman (OH, 6-3, soph)
- 12 Hannah Allison (S, 5-11, junior)
- 14 Sha'Dare McNeal (RS, 6-1, senior)
- 23 Bailey Webster (OH, 6-3, junior)
As can be seen, the Longhorns earned two points each on blocking in rotations A, C, and F. The blue arrows illustrate how pairs of players came together to block (i.e., did an outside player move toward the center to join the middle blocker, or did the middle blocker move outside?). As always, I tried to reconcile the notes I took at the match with what was reported in the play-by-play sheet. Due to one discrepancy, I could not pinpoint the location of one block. Recall that blocks are credited in the statistics only when immediately resulting in a point.
Also, as noted in the AVCA PowerPoint on keeping statistics (see links in right-hand column): "...it does NOT matter which player touches the ball – if 2-3 players go up for a block and one player touches it, each receives a block assist." I was nevertheless interested in which player's arm actually blocked the ball. In the figure, therefore, I listed the player first who actually touched the ball, then said "(with)" to refer to the additional player credited with the block (see asterisk in Rotation A as an example).
Obviously, the number of blocks in this exercise is small. However, with data from several matches, coaches could study their opponents' blocking success by rotation and location (left, center, and right) and instruct their teams to hit away from their opponents' advantageous blocking areas.
***
In other weekend action, Washington moved to 13-0 on the season with a 25-23, 26-24, 25-21 victory over USC on Friday night. If a match can be a tight three-game sweep, this was one of them. The box score doesn't leave a lot of clues as to why the match was so close, at least as far as I can tell. The Huskies outperformed the Trojans in hitting (.239-.221), blocking (11-4), and serving for aces (8-1, each team had 12 service errors). 'SC outdug U-Dub 43-29, but that would be reflected in the team hitting percentages (i.e., spiking a ball that is dug increases the hitting team's number of attempts, while depriving it of a kill). The Huskies' Krista Vansant continued her hot hitting, registering a .370 percentage on 12 kills (with only 2 errors) in 27 swings.
Last Saturday's Penn State at Minnesota contest featured a battle of coaching titans. Russ Rose has coached the Nittany Lions to five NCAA titles, whereas new Golden Gophers' coach Hugh McCutcheon has guided medal-winning U.S. teams in the last two Olympiad (the men to gold in 2008 and the women to silver in 2012). Not only that; both teams came in ranked in the top 10 nationally (PSU No. 1 and Minnesota No. 10). Though the match might have looked good on paper, in the end it was a rout, Penn State prevailing 25-23, 25-8, 25-20. In Game 2, the Gophers sided-out at a 29% clip (7-24), which is incredibly low for as good a team as Minnesota. In the same game, the Lions sided-out with 88% proficiency (8-9). For the match overall, Penn State dominated the hitting (.404-.098). The box score can be accessed here.
Friday, September 28, 2012
Breaking Down Wednesday's UCLA-Wash. Thriller
UCLA has shown a flair in this young season for the dramatic, beginning with an opening-weekend loss to Nebraska (15-13 in the fifth). Wednesday night, the Bruins played another epic match, losing in five at Washington as the Huskies won all three of their games by the minimum two-point margin (22-25, 30-28, 19-25, 28-26, 16-14.)
Despite entering the UCLA match undefeated, Washington was largely untested (a match against Purdue being the exception). Now, however, the Huskies have shown that they belong among the nation's elite.
The UCLA-Washington showdown featured a match-within-a-match aspect, namely a battle between the teams' slugging outside hitters. For the Huskies, it was sophomore Krista Vansant going against Bruin seniors Tabi Love and Rachael Kidder.
Based on the play-by-play sheet (which I accessed by going to the Huskies' schedule page and then clicking on the archived Gametracker for the UCLA match), I created the following chart of what I thought were the key statistical indicators (you may click on the chart to enlarge it). All of my tabulations from the Gametracker play-by-play matched the official box score, with the exception that I counted 30 kills for Vansant and the box score on the UW said she had 31. (Attacked balls kept in play are not listed on the play-by-play sheet, hence my focus on kills and errors.)
UCLA likely would have gone up 2-0 in games but for amazing U-Dub performances on two counts. Not only did Vansant record 10 kills with only 1 hitting error; the Huskies also blocked 6 Bruin spike attempts for immediate points (2 on swings by Kidder, 1 on a swing by Love).
Then, despite fifth games being shorter than the previous games (up to 15, instead of 25), Vansant amassed 7 kills (with 2 errors). She ended up hitting .448 on the night. Love, though hitting nearly error-free for most of the match, struggled a bit in Game 4, with 4 errors (3 balls hit astray and 1 attempt blocked). She ended up hitting .266. Kidder was a little more uneven, finishing up at .196.
The Huskies return to the court tonight, hosting USC.
Sunday, September 23, 2012
Oregon Sweep of USC Highlights Weekend
Two nights after defeating No. 1 UCLA to move to 13-0 on the season, the USC women came crashing back to earth. Oregon came into USC's Galen Center on Friday night and swept the Trojans, 25-19, 25-15, 25-23. The Ducks, now 11-0, must be considered among the nation's elite at this point in the season.
Against the Bruins on Wednesday, the Trojans seemingly sided-out at will, winning points on 71% of UCLA's serves. On Friday, the Ducks took siding-out to a new level against the Trojans, reaching 77% effectiveness. In the first two games especially, Oregon's serve-return performance was spectacular, attaining side-out rates of 84 and 81 percent (box score).
The Ducks outhit the Trojans, .357-.189. Three Oregon players recorded superb hitting nights: outside hitter Liz Brenner, .577 (16 kills, 1 error, 26 attempts); OH Alaina Bergsma, .438 (18-4-32); and middle blocker Ariana Williams, .375 (8-2-16). UO attempted 115 spikes, only 14 of which resulted in errors (6 hit out-of-bounds, 8 blocked by USC for immediate Trojan points). Of Oregon's 101 non-error attacks, USC dug up only 37 of them (37%). In contrast, 'SC dug much more effectively against UCLA, retrieving 46% of the Bruins' non-error attacks [58/(145 - 20)].
***
Across town on Friday, UCLA came back from its USC loss to rout Oregon State, 25-14, 25-18, 25-17. Clearly, the Beavers were not the same team that had beaten then-No. 2 Penn State on September 8.
Against Oregon State, UCLA outside hitters Tabi Love and Rachael Kidder recorded nearly identical hitting lines. Each hit .333 on 27 attempts, with Love amassing 12 kills and 3 errors, and Kidder, 14 kills and 5 errors.
Thursday, September 20, 2012
No. 2 USC defeats No. 1 UCLA
No. 2 USC defeated No. 1 UCLA last night, 28-26, 25-20, 24-26, 25-17. The match kicked-off a series of Wednesday-night telecasts on ESPN-U.
In reading the game article on the Trojan athletic website, I was impressed with the writer's attention to putting statistical figures in context. Many volleyball articles mention the players who had the most kills. However, merely stating the number of kills does not tell us how many attempts were required or how many errors the same hitter also had. As shown in the following brief excerpt from the article, the writer always made sure to accompany players' kill totals with their numbers of errors and attempts, and hitting percentage on the night.
UCLA's performance was hardly terrible. The Bruins sided-out, for example, at respectable levels of 62 and 63% in the first two games/sets, despite losing them both. The problem was that the Trojans did even better (66 and 80%, respectively). In none of the four games was USC's side-out rate lower than 65% (box score).
The Trojans also outhit the Bruins for the match, .311 to .297. For UCLA, Becca Strehlow's quick-sets to Mariana Aquino were working early. Aquino hit .385 on the night, with an 8-3-13 line for kills, errors, and attempts. As seen in the side-out numbers, the UCLA serve didn't challenge 'SC much. The Bruins' 11 service errors (to only 1 ace) suggest UCLA may have adopted a high-risk serving strategy to combat the Trojans' effective serve-receipt.
Also last night (and televised on Fox Sports' new Pac 12 Network), Stanford swept Cal.
In reading the game article on the Trojan athletic website, I was impressed with the writer's attention to putting statistical figures in context. Many volleyball articles mention the players who had the most kills. However, merely stating the number of kills does not tell us how many attempts were required or how many errors the same hitter also had. As shown in the following brief excerpt from the article, the writer always made sure to accompany players' kill totals with their numbers of errors and attempts, and hitting percentage on the night.
| USC women's volleyball senior opposite Katie Fuller
knocked down 21 kills (5e, 36att) and posted a .444 hitting percentage... Fuller's 21 kills matched a career high, but the Trojans got a major contribution from freshman outside hitter Samantha Bricio who also matched her career mark with 19 kills (6e, 50att, .260) to go with three service aces (23.0 points). Sophomore setter Hayley Crone notched a new career best with 53 assists and added four kills on second contact (0e, 5att, .800) and six digs. |
UCLA's performance was hardly terrible. The Bruins sided-out, for example, at respectable levels of 62 and 63% in the first two games/sets, despite losing them both. The problem was that the Trojans did even better (66 and 80%, respectively). In none of the four games was USC's side-out rate lower than 65% (box score).
The Trojans also outhit the Bruins for the match, .311 to .297. For UCLA, Becca Strehlow's quick-sets to Mariana Aquino were working early. Aquino hit .385 on the night, with an 8-3-13 line for kills, errors, and attempts. As seen in the side-out numbers, the UCLA serve didn't challenge 'SC much. The Bruins' 11 service errors (to only 1 ace) suggest UCLA may have adopted a high-risk serving strategy to combat the Trojans' effective serve-receipt.
Also last night (and televised on Fox Sports' new Pac 12 Network), Stanford swept Cal.
Sunday, September 9, 2012
Minnesota and Texas Split Matches in Austin
There's a new excitement surrounding University of Minnesota volleyball, with Hugh McCutcheon, who guided the U.S. men and women to, respectively, gold and silver in the last two Olympiad, taking over for retired coach Mike Hebert. The No. 14 Golden Gophers traveled down to Texas this past week for matches Thursday and Friday nights against the No. 4 Longhorns. The visit reciprocated a Texas trip to the Twin Cities last year, when the Gophers swept both matches.
This year, it was a split, with each match going four games (or sets). The Gophers won the opener by scores of 25-22, 25-13, 27-29, 29-27, whereas the Longhorns bounced back the following evening to win 25-20, 20-25, 25-22, 25-21. Here are the box scores for Thursday and Friday nights. I like these two-match series, as the added data provide a more reliable picture of how the teams are doing than the usual single match.
In Thursday night's Gopher win, offensive balance was the key. The following table shows the hitting percentages achieved by five leading Minnesota spikers, with their numbers of swings in parentheses. Two newcomers complement the established Gopher trio of Katherine Harms (senior outside hitter), Tori Dixon (junior middle blocker), and Ashley Wittman (junior OH). Daly Santana is a frosh OH from Puerto Rico, whereas Dana Knudsen (MB) is a senior transfer from Santa Clara. As the table shows, all five hit .276 or better in the series opener at Texas; Knudsen had 14 attempts, but all the others had 25 or more.
Friday night was a very different story, however. Dixon and Harms continued to hit well for the Gophers, but the Longhorns shut down Knudsen, Santana, and Wittman. One apparent reason for this is that Texas dominated the blocking Friday, by a 15.5-7 margin (the teams were essentially even on Thursday night, Texas 12, Minnesota 11.5).
For Texas offensively, it was the Haley and Bailey show, as outside hitters Haley Eckerman and Bailey Webster took the largest shares of the team's swings. The problem was that only one of the two could get untracked each night, Webster hitting .368 on Thursday and Eckerman, .289, on Friday. The following table shows the same statistics as in the earlier one for Minnesota.
On Thursday, Eckerman and Webster took 60% of the Horns' hitting attempts (88/147), with MB Khat Bell hitting .292 on 24 swings. Bell was held out on Friday; she is recovering from a torn ACL last season and Coach Jerritt Elliott evidently thought it prudent to rest Bell rather than have her play on back-to-back nights. Eckerman and Webster took on more of the hitting load Friday night, their combined 95 swings constituting 71% of the Longhorns' 134 total attempts.
Another apparent factor in Minnesota's Thursday win was the Gophers' digging advantage. Looking at the proportion of possible opponent attacks dug up (i.e., digs divided by opponents' non-error attacks), we see the following:
Thursday
Minnesota 67 digs / (Texas 147 spike attempts - 22 hitting errors) = .536
Texas 46 digs / (Minnesota 147 spike attempts - 23 hitting errors) = .371
Friday
Minnesota 51 digs / (Texas 134 spike attempts - 20 hitting errors) = .447
Texas 54 digs / (Minnesota 141 spike attempts - 29 hitting errors) = .482
On Thursday, the Gophers dug up more than half of the Longhorn hitting attempts that were not hit out-of-bounds or blocked for immediate Minnesota points. The following night, Minnesota was just under 50% in this department. Texas performed well in this area Friday night (48%), but not Thursday.
Texas coach Elliott did some shifting of players from their usual positions on Thursday, and then of course went without Bell on Friday. Perhaps the Longhorns will show greater match-to-match consistency as they settle into a regular lineup later in the season (if they do).
This year, it was a split, with each match going four games (or sets). The Gophers won the opener by scores of 25-22, 25-13, 27-29, 29-27, whereas the Longhorns bounced back the following evening to win 25-20, 20-25, 25-22, 25-21. Here are the box scores for Thursday and Friday nights. I like these two-match series, as the added data provide a more reliable picture of how the teams are doing than the usual single match.
In Thursday night's Gopher win, offensive balance was the key. The following table shows the hitting percentages achieved by five leading Minnesota spikers, with their numbers of swings in parentheses. Two newcomers complement the established Gopher trio of Katherine Harms (senior outside hitter), Tori Dixon (junior middle blocker), and Ashley Wittman (junior OH). Daly Santana is a frosh OH from Puerto Rico, whereas Dana Knudsen (MB) is a senior transfer from Santa Clara. As the table shows, all five hit .276 or better in the series opener at Texas; Knudsen had 14 attempts, but all the others had 25 or more.
| Thursday | Friday | |
| Tori Dixon | .286 (28) | .320 (25) |
| Katherine Harms | .319 (47) | .357 (28) |
| Dana Knudsen | .286 (14) | .000 (12) |
| Daly Santana | .276 (29) | .030 (33) |
| Ashley Wittman | .400 (25) | .000 (34) |
Friday night was a very different story, however. Dixon and Harms continued to hit well for the Gophers, but the Longhorns shut down Knudsen, Santana, and Wittman. One apparent reason for this is that Texas dominated the blocking Friday, by a 15.5-7 margin (the teams were essentially even on Thursday night, Texas 12, Minnesota 11.5).
For Texas offensively, it was the Haley and Bailey show, as outside hitters Haley Eckerman and Bailey Webster took the largest shares of the team's swings. The problem was that only one of the two could get untracked each night, Webster hitting .368 on Thursday and Eckerman, .289, on Friday. The following table shows the same statistics as in the earlier one for Minnesota.
| Thursday | Friday | |
| Haley Eckerman | .080 (50) | .289 (45) |
| Bailey Webster | .368 (38) | .100 (50) |
On Thursday, Eckerman and Webster took 60% of the Horns' hitting attempts (88/147), with MB Khat Bell hitting .292 on 24 swings. Bell was held out on Friday; she is recovering from a torn ACL last season and Coach Jerritt Elliott evidently thought it prudent to rest Bell rather than have her play on back-to-back nights. Eckerman and Webster took on more of the hitting load Friday night, their combined 95 swings constituting 71% of the Longhorns' 134 total attempts.
Another apparent factor in Minnesota's Thursday win was the Gophers' digging advantage. Looking at the proportion of possible opponent attacks dug up (i.e., digs divided by opponents' non-error attacks), we see the following:
Thursday
Minnesota 67 digs / (Texas 147 spike attempts - 22 hitting errors) = .536
Texas 46 digs / (Minnesota 147 spike attempts - 23 hitting errors) = .371
Friday
Minnesota 51 digs / (Texas 134 spike attempts - 20 hitting errors) = .447
Texas 54 digs / (Minnesota 141 spike attempts - 29 hitting errors) = .482
On Thursday, the Gophers dug up more than half of the Longhorn hitting attempts that were not hit out-of-bounds or blocked for immediate Minnesota points. The following night, Minnesota was just under 50% in this department. Texas performed well in this area Friday night (48%), but not Thursday.
Texas coach Elliott did some shifting of players from their usual positions on Thursday, and then of course went without Bell on Friday. Perhaps the Longhorns will show greater match-to-match consistency as they settle into a regular lineup later in the season (if they do).
Subscribe to:
Posts (Atom)
Semi-Retirement of VolleyMetrics Blog
With all of the NCAA volleyball championships of the 2023-24 academic year having been completed -- Texas sweeping Nebraska last December t...
-
Two years ago, I created a very simple prediction equation for the NCAA women's tournament. Each team gets its own value on the predicti...
-
I was invited once again this year to vote for the Off the Block men's collegiate volleyball awards . The number of awards has increased...
-
With this year's NCAA women's Final Four getting underway Thursday night in Seattle, today's posting offers some statistical obs...


