I don't know that there's a lot to say about last night's three-game sweep that gave Penn State its fourth straight NCAA women's volleyball title. Other than in Game 2, in which Cal had a pair of set points, there was very little drama.
The statistical issue that got the most attention on ESPN's broadcast was how the Golden Bears' Tarah Murrey was getting nearly half of her team's hit attempts (she ended with 46% of them, 56/121), thus letting Penn State devote its attention to stopping her. And stop Murrey the Nittany Lions did, holding her to a very uncharacteristically low .143 hitting percentage (box score). In the semifinals against Texas, in contrast, Murrey hit .413.
For Penn State, middle-blocker Arielle Wilson exhibited her usual blend of steadiness and power, hitting .391, and right-side hitter Blair Brown punched in at .316. Outside-hitter Deja McClendon, though hitting only .250 on the night, got off to a fast start; of her 16 total kills, she recorded six each in Games 1 and 2 (play-by-play sheet).
Cal actually outblocked Penn State, 11 to 7, but the Lion block was there when they needed it, on both of the aformentioned Golden Bear set points in Game 2.
Sunday, December 19, 2010
Friday, December 17, 2010
It's Penn State and Cal in Saturday Night's Final
Below, I've circled what I think are some key numbers from last night's two NCAA women's semifinal matches (I did screen captures of the official box scores, then annotated them in PowerPoint). One thing that's clear right off the bat is that the two winning teams, Penn State and Cal, each sided-out extremely well. With those kinds of side-out percentages, teams will very rarely lose games (sets).
In my Penn State-Texas preview, I had concluded that, "Blocking may provide Penn State with a decisive edge in holding down Texas's hitting effectiveness." I don't often make such spot-on predictions, so when I do, I like to toot my own horn a little. As seen in the following boxscore, the Nittany Lions dominated the blocking and slowed down two Longhorn hitters who had been very productive of late, Rachael Adams and Jennifer Doris. Throw in a torrid hitting performance from Penn State's Deja McClendon and a three-game romp is the result. (You may click on the images to enlarge them.)

Similarly, Cal accomplished what I thought it needed to, in order to finally break through and beat USC this season. Adrienne Gehan, who struggled mightily in both Bear-Trojan matches during Pac-10 play, recorded a .393 hitting percentage last night, complementing Bear star Tarah Murrey (.413). Defensively, Cal slowed down nearly the whole SC team, but especially middle blockers Alexis Olgard and Lauren Williams, who had punished the Bears in the the teams' earlier meetings. Alex Jupiter never aligned with Mars (a music lyric reference) nor with Trojan setter Kendall Bateman very much, for that matter.

In my Penn State-Texas preview, I had concluded that, "Blocking may provide Penn State with a decisive edge in holding down Texas's hitting effectiveness." I don't often make such spot-on predictions, so when I do, I like to toot my own horn a little. As seen in the following boxscore, the Nittany Lions dominated the blocking and slowed down two Longhorn hitters who had been very productive of late, Rachael Adams and Jennifer Doris. Throw in a torrid hitting performance from Penn State's Deja McClendon and a three-game romp is the result. (You may click on the images to enlarge them.)


So, who wins the final? Both teams have been dominant in the postseason, dropping only one game combined (Penn State vs. Duke). Cal has faced tougher competition, including having to play Washington in the Seattle regional. Still, one can never count out Penn State. The old football cliche about teams that "don't rebuild, they reload" seems quite applicable to the Lions. I'll predict a five-game match and leave it at that...
Thursday, December 16, 2010
NCAA Women's Final Four Preview II: USC vs. California
Tonight's second semifinal match of the NCAA women's Final Four will be an all-Pac-10 battle, with the University of Southern California (USC) taking on the University of California, Berkeley. What gives this match a little extra intrigue is that these teams have already met twice this season in conference play, with USC winning both times. The Trojans actually had a harder time holding off the Golden Bears -- 17-15 in the fifth game -- October 9 in Los Angeles (boxscore) than up in Berkeley, where USC prevailed in four games (boxscore).
As usual, I've been focusing a lot on hitting percentage during the tournament, and the following table tells us which players have (and have not) done well in this season's USC-Cal head-to-head match-ups.

As discussed in yesterday's preview of tonight's other semifinal between Penn State and Texas, middle blockers will often have higher hitting percentages than outside hitters, because the latter likely receive a greater number of impromptu, desperation sets when a team is out of system. Having said that, though, USC's two giant middle blockers, Alexis Olgard (6-foot-5) and Lauren Williams (6-4, a third-team All-America), have attacked extraordinarily well against Cal this season, with hitting percentages of .389 and .349, respectively.
On the other hand, the Trojans' outside-hitting corps, led by first team AVCA All-America Alex Jupiter, has been held in check against Cal. As can be seen above, Jupiter, Falyn Fonoimoana, and Katie Fuller have all hit in the range of .222-.235 in the two matches against the Golden Bears. One important task for Trojan setter Kendall Bateman, a second-team All-America, will therefore be to get her outside hitters going.
Middle blocker Kat Brown has held her own against SC, hitting .312, while opposite hitter Correy Johnson, an honorable mention for All-America honors, has hit .250. Adrienne Gehan (OH/opposite) and Shannon Hawari (middle) have been almost totally neutralized by USC, compiling virtually as many hitting errors as successful kills.
As usual, I've been focusing a lot on hitting percentage during the tournament, and the following table tells us which players have (and have not) done well in this season's USC-Cal head-to-head match-ups.

As discussed in yesterday's preview of tonight's other semifinal between Penn State and Texas, middle blockers will often have higher hitting percentages than outside hitters, because the latter likely receive a greater number of impromptu, desperation sets when a team is out of system. Having said that, though, USC's two giant middle blockers, Alexis Olgard (6-foot-5) and Lauren Williams (6-4, a third-team All-America), have attacked extraordinarily well against Cal this season, with hitting percentages of .389 and .349, respectively.
On the other hand, the Trojans' outside-hitting corps, led by first team AVCA All-America Alex Jupiter, has been held in check against Cal. As can be seen above, Jupiter, Falyn Fonoimoana, and Katie Fuller have all hit in the range of .222-.235 in the two matches against the Golden Bears. One important task for Trojan setter Kendall Bateman, a second-team All-America, will therefore be to get her outside hitters going.
Cal OH Tarah Murrey, powered by her fellow Cal first-team All-America, setter Carli Lloyd, has overcome any difficulties outside hitters have in recording high hitting percentages, going .364 in the Bears' two matches against the Trojans.
Middle blocker Kat Brown has held her own against SC, hitting .312, while opposite hitter Correy Johnson, an honorable mention for All-America honors, has hit .250. Adrienne Gehan (OH/opposite) and Shannon Hawari (middle) have been almost totally neutralized by USC, compiling virtually as many hitting errors as successful kills.
So there you have what I think are the key questions for tonight. Can the Golden Bears limit the damage from the Trojans' middle blockers, while still keeping the SC outside hitters under wraps? And can Tarah Murrey get a little help from her friends, as Cal tries to match SC offensively?
Wednesday, December 15, 2010
NCAA Women's Final Four Preview I: Penn State vs. Texas
The first of Thursday night's two NCAA women's national semifinal matches presents a rematch of last year's championship contest, Penn State vs. Texas. The nightcap will feature two Pac-10 foes, USC and Cal. The present write-up will focus on Penn State and Texas, with another one tomorrow for USC and Cal.
My starting point in analyzing the Nittany Lions and Longhorns is to examine to what degree, if any, the teams have changed over the past three months in their allocation of sets to different hitters and these players' hitting percentages. Back in early September, on the eve of the Big Four tournament -- with Florida hosting Penn State, Texas, and Stanford -- I presented graphs of each team's leading hitters.
The key elements of these graphs are as follows. Each team gets its own graph. The graph consists of several bars, one for each hitter. A bar's height represents that player's hitting percentage (based on some reference timeframe) and its width represents the player's share of the team's hitting attempts. For convenience, a given team's bars are arranged, left to right, from the player with the highest hitting percentage to the one with the lowest. One wants to see rectangles that are both tall and wide, signifying that players with high hitting percentages are taking the most attempts.
What we're going to see is a comparison of "old" and "new." The old graphs are the ones from September, based on matches prior to the Florida tournament. The new ones are based on teams' statistics from the first four rounds of this year's NCAA tourney, the four matches a team won to reach the Final Four.
To create the new graphs, we of course have to look at each team's tournament matches, one-by-one, before aggregating the statistics. In the first table immediately below, we see the statistical hitting lines (kills, errors, and total attempts) for each of Texas's and Penn State's main hitters, match-by-match. Together, the five listed Longhorn players accounted for 95.4% of UT's spike attempts in the first four rounds of the NCAA tournament, whereas the listed Lion players accounted for 86.5% of Penn State's spike attempts. As always, you can click on the graphics to enlarge them.

One Texas player immediately jumps out at me, namely middle-blocker Jennifer Doris, who has only one hitting error in the entire postseason (on 58 hitting attempts). In the regionals, Doris had 8 kills and no errors in 14 swings against Illinois, and 10 kills with no errors in 18 attempts against Purdue. I'll discuss Doris and other Longhorn hitters further when I get to the team's graph (below).
Among the Nittany Lions in their table, middle-blocker Arielle Wilson has performed well in most of the team's tournament matches, outside-hitter Blair Brown (who hits on the right-hand side, in contrast to most prominent OH's) excelled vs. Oklahoma, and OH Deja McClendon exhibited her most sustained productivity against Duke.
Let's now look at the graphs. The larger (light-orange) graph represents Texas in the current postseason, with the September graph (smaller, burnt-orange) shown for comparison.

Middle-blocker Rachael Adams, who was just named first-team All-America by the American Volleyball Coaches Association (AVCA), comes out as the Longhorns' highest-percentage hitter in both graphs. In what seems like a wise move (as seen by Adams's light-orange bar being wider than her burnt-orange one), UT has increased Adams's share of the team's spike attempts, from 11.6 percent in September to 18.8 percent presently.
Sha'Dare McNeal has seen her proportion of Longhorn hit attempts shrink from 17.0 to 11.3 percent, perhaps as a way of increasing Doris's swings (from 8.6 to 12.4 percent). Of course, I have no way to know if such changes are intentional or just coincidental.
Juliann Faucette (OH), who has taken about one-third of UT's swings in the postseason, joined Adams on the AVCA All-America first team. Faucette's hitting percentage is lower than those of her aforementioned teammates; however, as an outside hitter, she may be called upon to take a greater number of improvised swings to bail the team out of danger, in contrast to middle-blockers whose quick attempts tend to be by design. (See my earlier posting on out-of-system play and the related commentary on VolleyTalk.)
For Penn State, the larger (lighter-blue) graph shows the current postseason, whereas the smaller (dark-blue) graph is from September.
The Nittany Lions have featured a "big-three" attack this season, with the aforementioned Wilson, Brown, and McClendon. All three also received AVCA All-America honors, with Wilson and Brown making the first team and McClendon, the second (also being voted Freshman of the Year). Other than somewhat of a shift from September from when McClendon and Brown took about the same share of Penn State's hit attempts to the postseason, where Brown has been getting more attempts than McClendon, the Nittany Lion offense looks structurally pretty similar at the two stages of the season.
On the whole, in fact, I'm struck by both teams' consistency between their respective September and postseason graphs, even though the games comprising the September and postseason graphs are mutually exclusive.
Blocking may provide Penn State with a decisive edge in holding down Texas's hitting effectiveness. I've gone on for a long time, but let me just conclude with the observation that Penn State ranks fifth in the nation in blocks per set, whereas Texas is 35th.
My starting point in analyzing the Nittany Lions and Longhorns is to examine to what degree, if any, the teams have changed over the past three months in their allocation of sets to different hitters and these players' hitting percentages. Back in early September, on the eve of the Big Four tournament -- with Florida hosting Penn State, Texas, and Stanford -- I presented graphs of each team's leading hitters.
The key elements of these graphs are as follows. Each team gets its own graph. The graph consists of several bars, one for each hitter. A bar's height represents that player's hitting percentage (based on some reference timeframe) and its width represents the player's share of the team's hitting attempts. For convenience, a given team's bars are arranged, left to right, from the player with the highest hitting percentage to the one with the lowest. One wants to see rectangles that are both tall and wide, signifying that players with high hitting percentages are taking the most attempts.
What we're going to see is a comparison of "old" and "new." The old graphs are the ones from September, based on matches prior to the Florida tournament. The new ones are based on teams' statistics from the first four rounds of this year's NCAA tourney, the four matches a team won to reach the Final Four.
To create the new graphs, we of course have to look at each team's tournament matches, one-by-one, before aggregating the statistics. In the first table immediately below, we see the statistical hitting lines (kills, errors, and total attempts) for each of Texas's and Penn State's main hitters, match-by-match. Together, the five listed Longhorn players accounted for 95.4% of UT's spike attempts in the first four rounds of the NCAA tournament, whereas the listed Lion players accounted for 86.5% of Penn State's spike attempts. As always, you can click on the graphics to enlarge them.

One Texas player immediately jumps out at me, namely middle-blocker Jennifer Doris, who has only one hitting error in the entire postseason (on 58 hitting attempts). In the regionals, Doris had 8 kills and no errors in 14 swings against Illinois, and 10 kills with no errors in 18 attempts against Purdue. I'll discuss Doris and other Longhorn hitters further when I get to the team's graph (below).
Among the Nittany Lions in their table, middle-blocker Arielle Wilson has performed well in most of the team's tournament matches, outside-hitter Blair Brown (who hits on the right-hand side, in contrast to most prominent OH's) excelled vs. Oklahoma, and OH Deja McClendon exhibited her most sustained productivity against Duke.
Let's now look at the graphs. The larger (light-orange) graph represents Texas in the current postseason, with the September graph (smaller, burnt-orange) shown for comparison.

Middle-blocker Rachael Adams, who was just named first-team All-America by the American Volleyball Coaches Association (AVCA), comes out as the Longhorns' highest-percentage hitter in both graphs. In what seems like a wise move (as seen by Adams's light-orange bar being wider than her burnt-orange one), UT has increased Adams's share of the team's spike attempts, from 11.6 percent in September to 18.8 percent presently.
Sha'Dare McNeal has seen her proportion of Longhorn hit attempts shrink from 17.0 to 11.3 percent, perhaps as a way of increasing Doris's swings (from 8.6 to 12.4 percent). Of course, I have no way to know if such changes are intentional or just coincidental.
Juliann Faucette (OH), who has taken about one-third of UT's swings in the postseason, joined Adams on the AVCA All-America first team. Faucette's hitting percentage is lower than those of her aforementioned teammates; however, as an outside hitter, she may be called upon to take a greater number of improvised swings to bail the team out of danger, in contrast to middle-blockers whose quick attempts tend to be by design. (See my earlier posting on out-of-system play and the related commentary on VolleyTalk.)
For Penn State, the larger (lighter-blue) graph shows the current postseason, whereas the smaller (dark-blue) graph is from September.

The Nittany Lions have featured a "big-three" attack this season, with the aforementioned Wilson, Brown, and McClendon. All three also received AVCA All-America honors, with Wilson and Brown making the first team and McClendon, the second (also being voted Freshman of the Year). Other than somewhat of a shift from September from when McClendon and Brown took about the same share of Penn State's hit attempts to the postseason, where Brown has been getting more attempts than McClendon, the Nittany Lion offense looks structurally pretty similar at the two stages of the season.
On the whole, in fact, I'm struck by both teams' consistency between their respective September and postseason graphs, even though the games comprising the September and postseason graphs are mutually exclusive.
Blocking may provide Penn State with a decisive edge in holding down Texas's hitting effectiveness. I've gone on for a long time, but let me just conclude with the observation that Penn State ranks fifth in the nation in blocks per set, whereas Texas is 35th.
Wednesday, December 8, 2010
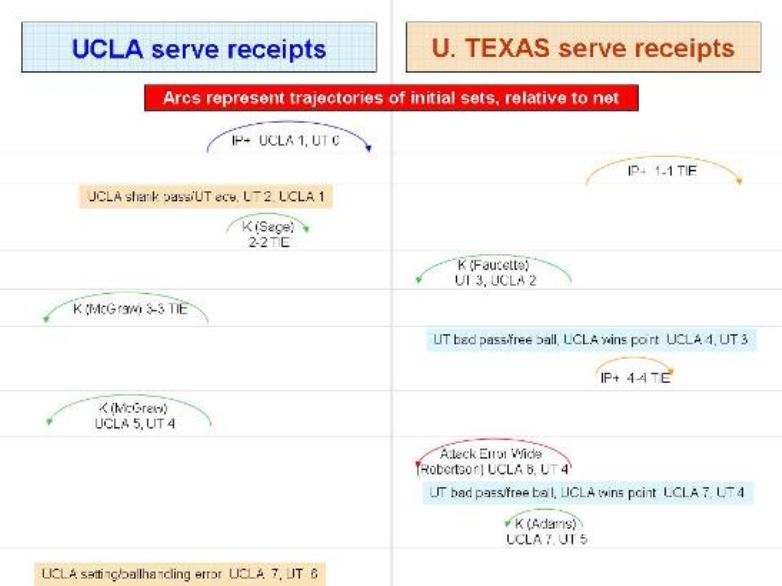
Graphing the Trajectories or Arcs of Sets to Hitters in a Match (UCLA-Texas 2010 NCAA Second Round)
Today's entry falls under the rubric of, "It seemed like a good idea at the time." While watching last Saturday night's webcast of the UCLA-Texas women's NCAA second-round match, I decided to create what, to my knowledge, would be a novel type of play-by-play sheet that visually depicted the trajectories of each team's initial sets in mounting an attack from serve receipt.
Being able to check, at a glance, whether a team was varying its attacks between high and outside (a "4 set"), quick middle hits (a "1 set"), and other varieties of plays, and its success in siding-out with the various types of attacks, would seem to be valuable information. Further, because the webcast was shown entirely from an "end zone" camera, it was relatively easy to observe the arcs of the sets.
What I didn't bargain for was that, even graphing merely a single game (Game 2, which ended up being the only one taken by the Bruins), the process of manually creating the following PowerPoint slides from my original written notes and verifying them as best as I could against the conventional play-by-play sheet consumed several hours over the next few nights. If there is to be a future for this type of diagram -- and I'm eager to see if people think there should be -- we have to hope that someone creates special software for this purpose.
Before discussing the diagram (which actually consists of four stacked images, due to space limitations for any one image), some limitations must be acknowledged: (1) only the teams' plays directly off of serve receipt are shown, not any sets from continuing rallies; (2) the arcs and ultimate results of each play are based on my handwritten notes taken live, as there did not appear to be a way to save a file of the completed video to watch it multiple times; and (3) as a result of the second limitation, I just plain missed some serves (for example, I may have still been writing from the previous play).
OK, here are the diagrams. I would urge readers to click on each frame to enlarge it. The rectangles at the top for each team are meant to symbolize a net, relative to which the arcs of the sets can be seen. The camera was behind UCLA's end, so the charts for the Bruins are a direct reproduction of my hand drawings. For the Longhorns, I initially drew the arcs as they appeared to me and later flipped them horizontally to reflect how they would look from the UT side of the net.


As can be seen, UCLA frequently went to outside (left) hitter Dicey McGraw and she often produced kills for quick side-outs (I did not record the identity of the hitter while watching live, getting the names from the play-by-play sheet for kills and hitting errors). In contrast, Texas seemed to sport a more diversified attack, setting several different hitters at various locations along the net.
Unfortunately, conclusions and inferences are limited by having a record of just one game. Manual production of such diagrams for three or more games per match, even aided by the copy-and-paste functions, would be prohibitively time-consuming. Here's hoping that someone comes up with a way for an observer to enter minimal raw data into a software package that can generate visual diagrams similar to (or even better than) the ones above.
UPDATE: In response to a note I put on VolleyTalk about this posting, one of the discussants suggested DataVolley as a software program for recording and plotting information from volleyball matches. There apparently is a free version one can download, as well as more elaborate versions for purchase.
Being able to check, at a glance, whether a team was varying its attacks between high and outside (a "4 set"), quick middle hits (a "1 set"), and other varieties of plays, and its success in siding-out with the various types of attacks, would seem to be valuable information. Further, because the webcast was shown entirely from an "end zone" camera, it was relatively easy to observe the arcs of the sets.
What I didn't bargain for was that, even graphing merely a single game (Game 2, which ended up being the only one taken by the Bruins), the process of manually creating the following PowerPoint slides from my original written notes and verifying them as best as I could against the conventional play-by-play sheet consumed several hours over the next few nights. If there is to be a future for this type of diagram -- and I'm eager to see if people think there should be -- we have to hope that someone creates special software for this purpose.
Before discussing the diagram (which actually consists of four stacked images, due to space limitations for any one image), some limitations must be acknowledged: (1) only the teams' plays directly off of serve receipt are shown, not any sets from continuing rallies; (2) the arcs and ultimate results of each play are based on my handwritten notes taken live, as there did not appear to be a way to save a file of the completed video to watch it multiple times; and (3) as a result of the second limitation, I just plain missed some serves (for example, I may have still been writing from the previous play).
OK, here are the diagrams. I would urge readers to click on each frame to enlarge it. The rectangles at the top for each team are meant to symbolize a net, relative to which the arcs of the sets can be seen. The camera was behind UCLA's end, so the charts for the Bruins are a direct reproduction of my hand drawings. For the Longhorns, I initially drew the arcs as they appeared to me and later flipped them horizontally to reflect how they would look from the UT side of the net.


Unfortunately, conclusions and inferences are limited by having a record of just one game. Manual production of such diagrams for three or more games per match, even aided by the copy-and-paste functions, would be prohibitively time-consuming. Here's hoping that someone comes up with a way for an observer to enter minimal raw data into a software package that can generate visual diagrams similar to (or even better than) the ones above.
UPDATE: In response to a note I put on VolleyTalk about this posting, one of the discussants suggested DataVolley as a software program for recording and plotting information from volleyball matches. There apparently is a free version one can download, as well as more elaborate versions for purchase.
Tuesday, November 30, 2010
2010 NCAA Women's Preview: Seeded Teams' Hitting Percentages Against Other Seeded Teams
For pretty much the entire four years that I've maintained this blog, I've extolled the importance of hitting percentage as a measure of a team's overall ability. To win games (sets) and matches, teams need points. Hitting percentage is based heavily on teams' productivity in winning points via kills, but penalizes teams for hitting errors, which of necessity give points to the opponent. Dividing (kills - errors) by total attempts further weakens teams' hitting percentages if a lot of their attempts are kept in play by the other team. If a team compiles a high hitting percentage and limits its opponents' hitting percentage, it will probably win a lot of matches.
Last year in previewing the start of the NCAA women's tournament, I showed that there was a strong correlation where the highest seeded teams also had the highest hitting percentages. I used teams' overall regular-season hitting percentages, however, which don't take into account degree of schedule difficulty, both across teams and within different parts of the season for any one given team.
To refine the methodology, I've done similar calculations on the eve (approximately) of this year's tournament, but looking only at seeded teams' hitting percentages against other seeded teams they played during the regular season. (You may click on the table below to enlarge it, noting also that the table appears in separate upper and lower blocks due to space limitations within a single block.)


If we were going purely on teams' average hitting percentages against other teams that ended up being seeded, then Stanford at .290 and Cal at .280 would be undervalued in the seedings (see blue circles in the right-hand column). Cal's average is based on only four matches, however, and in two of them (against Stanford) the Golden Bears hit at sizzling levels around .350. Northern Iowa really looks out of place as the No. 5 seed with its .171 average hitting percentage, which came only against some of the less higher-seeded teams.
Defense (i.e., holding opponents to low hitting percentages) appears to align better with seeding. As can be seen (literally) in the bottom line, the top five seeds each held their seeded opponents to hitting percentages around .200 (this may be Northern Iowa's saving grace).
Between the No. 6-12 seeds, nearly all of the teams held their seeded opponents to roughly .250 hitting. The one exception was No. 10 seed Minnesota, which held its seeded opponents to a paltry .185 average hitting percentage (see red circle). The Golden Gophers did allow Penn State to approach .300 in both Big Ten matches between the teams, but shut down other teams such as Duke (.044) and Dayton (.117).
The No. 13 and 14 teams, LSU and Dayton, respectively, held their seeded opponents to roughly .260 hitting. Lastly, we have No. 15 Hawaii, which played only one match all season against a team that ended up being seeded, and No. 16 Purdue. The Boilermakers were pretty "lights-out" (to borrow a baseball expression) in shutting down opponents' offenses, including in one of two matches against Penn State. The only problem for Purdue is that it hasn't hit that well itself against top competition.
We'll soon see the effectiveness (or lack thereof), in terms of prognostic success, of looking at the teams through this lens.
Friday, November 26, 2010
JQAS Article Examines Relationship Between Opponent's Blocking Strategy and Allocation of Sets to Different Hitters
The latest issue of the online Journal of Quantitative Analysis in Sports includes the article "Relationship between the Opponent Block and the Hitter in Elite Male Volleyball," by Rui Manuel Araújo, José Castro, Rui Marcelino, and Isabel R. Mesquita. A brief summary (abstract) is available here. Full-text access is by subscription, but the journal has guest viewing privileges for individual articles.
This study is based on observations from the 2007 World Cup of men's volleyball. The authors studied setters' allocation decisions in relation to two features of the opposing block: the spacing of the blockers along the front row at the start of the point, and the type of block being faced (none, single, double, triple; the latter two also categorized as "compact" or with open spaces between the blockers). Analyses (via chi-square) were entirely two-way (allocation vs. spacing; and allocation vs. type of block), with no three-way analyses.
Because the article refers extensively to the six zones of the court often used in coaching, I created the following diagrams of the blocking team's side to illustrate the different types of initial block spacing described in the article (click here for more information on the zone system). The distinctions among the blocking arrangements mainly boil down to whether one or both outside blockers are "spread" (i.e., positioned toward the sideline) or "pinched" (i.e., positioned toward the middle blocker).

Overall, 41.2% of the sets went to teams' two left-side or "ace" hitters; 32.1% to teams' opposite (right-side) hitter; and 25% to teams' two middle hitters. The setter himself took the remaining 1.7% of attacks. Of the findings relating set allocation to characteristics of the block, here are what appear to be the main ones:
The article was, for the most part, straightforward to follow. However, a few little things were confusing, such as some percentages in one of the tables that should have added horizontally to 100% (where the total at the end of the row even said 100%), but the numbers didn't in fact sum to 100. This kind of research is difficult to do, however, with extensive videotaping and coding of matches, so I commend the authors for their work.
This study is based on observations from the 2007 World Cup of men's volleyball. The authors studied setters' allocation decisions in relation to two features of the opposing block: the spacing of the blockers along the front row at the start of the point, and the type of block being faced (none, single, double, triple; the latter two also categorized as "compact" or with open spaces between the blockers). Analyses (via chi-square) were entirely two-way (allocation vs. spacing; and allocation vs. type of block), with no three-way analyses.
Because the article refers extensively to the six zones of the court often used in coaching, I created the following diagrams of the blocking team's side to illustrate the different types of initial block spacing described in the article (click here for more information on the zone system). The distinctions among the blocking arrangements mainly boil down to whether one or both outside blockers are "spread" (i.e., positioned toward the sideline) or "pinched" (i.e., positioned toward the middle blocker).

Overall, 41.2% of the sets went to teams' two left-side or "ace" hitters; 32.1% to teams' opposite (right-side) hitter; and 25% to teams' two middle hitters. The setter himself took the remaining 1.7% of attacks. Of the findings relating set allocation to characteristics of the block, here are what appear to be the main ones:
- A "lower [frequency] than expected between ... pinched starting points and attack of the 1st middle hitter..." (of the team's two middle hitters).
- "The individual block happened more than expected when the attack was performed by the middle hitters..., because most attacks of this player are fast and executed on the central zone of the net close to the setter ... not often allowing the double or triple block formation..."
- "...the opposite player performed the attack against the double block situation... more than expected..."
- "Concerning the [left-side/ace] outside hitter [both of a team's two], this player faced the individual block lower than expected and the triple block, the open triple block and the compact double block more than expected."
- "...the open triple block was more used than expected against the [1st] left-side hitter..."
The article was, for the most part, straightforward to follow. However, a few little things were confusing, such as some percentages in one of the tables that should have added horizontally to 100% (where the total at the end of the row even said 100%), but the numbers didn't in fact sum to 100. This kind of research is difficult to do, however, with extensive videotaping and coding of matches, so I commend the authors for their work.
Tuesday, November 9, 2010
Side-Out Success Based on Whether Teams Stay "In System" on Serve-Receipt
Increasingly, it seems, one hears of volleyball teams getting "out of system" or having to recover from same. According to Bonnie Kenny and Cindy Gregory's book Volleyball: Steps to Success, "Out-of-system play occurs during a rally when something happens to take the team away from the preferred pass, set, hit or dig, set, hit sequence" (p. 141). I decided several weeks ago that, while watching several upcoming matches on television, I would keep some statistics on women's college teams' ability to stay in-system on their serve receipt, and how this would relate to their likelihood of ultimately winning the rally (i.e., siding-out).
I coded one game (set) each from the following matches: Illinois at Minnesota (box score, ESPN 3 video); South Carolina at Florida (box score); Nebraska at Texas (box score); Oklahoma at Texas A&M (box score); and Penn State at Michigan (box score).
As teams attempted to run their offense in immediate response to the opponent's serve, it was usually pretty easy to classify whether they were in or out of system. Certainly, if someone other than the setter made the second contact, or if the team was aced or made an overpass, it was out of system. I also considered a sequence to be out of system (although not as egregiously) if the setter had to tip (with one hand) or bump the ball to the hitter. In addition, I recorded whether the receiving team successfully sided-out (not just an immediate side-out, i.e., serve, pass, set, kill, but all side-outs, regardless of how long the rally lasted).
I clearly expected teams to exhibit greater side-out success rates when their initial response to the opponent's serve was in, as compared to out of, system. To get an idea of the magnitude of the difference, however, we needed some empirical data, hence the following analyses. The following chart (which you can click on to enlarge) contains the key information. The data should be considered only an approximation, as I sometimes missed a play or two per game (sometimes it was my fault due to a momentary lapse of attention, but other times things were outside of my control, such as a TV replay interrupting the beginning of the next point). Because the numbers for any one team would be too small for statistical analysis, I added up the data for each column for all the teams, thus producing aggregate figures.

When teams mounted an in-system (i.e., pass, set, spike) response to the opponent's serve, they sided-out nearly 63% of the time (102/163). In stark contrast, when the serve-receipt got out of system, the team sided-out only around 10% of the time (4/39). For statistically trained readers out there, this difference in percentages is highly significant via a chi-square test (X2 = 34.5, df = 1, p < .001).
It did not surprise me that teams rarely win the point when they start off out of system. It surprised me a little bit, though, that teams did not side-out more frequently when they mounted an in-system response to serve. A spike cleanly set up and delivered is no guarantee of winning the point, however, as the ball can be blocked or dug. As anyone who saw this past weekend's Penn State-Michigan match knows, there was a sequence in Game 1 during which the Wolverines consistently mounted in-system attacks -- and consistently got stuffed by the Nittany Lions!
Another thing I found interesting, albeit which must be qualified by the small number of observations, is the variation in how often teams got out of system. National No.1-ranked Florida never went out of system in the game I coded, whereas the Gators' tough serving knocked South Carolina out of system a whopping 10 times. On average, teams got out of system 3.9 times within the span of one game (set).
This investigation, like many of my previous ones, aimed to provide an initial look at a phenomenon, in this case out-of-system play, and put some ideas out there for operational measures and statistical analyses. Further research could examine whether particular servers are adept at getting the opponent out of system, as well as probe in/out-of-system status not just in response to the opponent's serve, but also to spikes and free balls.
UPDATE: This topic has generated some interesting discussion at VolleyTalk. Here's a link to the thread.
Saturday, October 2, 2010
Texas Tech Ends 64-Match Conference Losing Streak

Texas Tech University's women's volleyball team tonight ended its 64-match losing streak in Big 12 conference play, with a five-game win over Kansas. I'm on the faculty at Texas Tech, so I've eagerly been awaiting this day! The Big 12 schedule is 20 games (Oklahoma State doesn't field a volleyball squad, so each team has 10 opponents, each played home and away). The Red Raiders won their conference opener in 2007, then dropped their remaining 19. Seasons of 0-20 followed in 2008 and 2009, and then the team started off 0-5 in the Big 12 this year.
Tonight's win seemed less a matter of Texas Tech raising its overall team hitting percentage compared to the previous five losses (black bars in the graph immediately below), than dramatically curtailing the opponent's hitting percentage (blue bars in the second graph).


There have been at least two other favorable signs for the Red Raiders, of late. One is the improved hitting of offensive workhorse Amanda Dowdy (who has taken roughly one-third of the team's spike attempts this season), as shown in the red bars above. Dowdy injured an ankle in the Baylor match, but showed no ill effects tonight.
Texas Tech also had nine aces against Kansas. I attended an earlier Raider match this season, a three-game loss to Kansas State, where Texas Tech had only one ace. It seems the team is serving a lot more aggressively now, which should make it harder for the opponent to side-out.
Thursday, September 9, 2010
Preview of 2010 Big Four Tournament
In anticipation of this weekend's Big Four tournament -- bringing No. 1 Penn State, No. 2 Stanford, No. 4 Florida, and No. 5 Texas to Gator country -- I've created hitting proficiency/attempt (P/A) graphs for each of the teams. I first introduced these graphs in my August 30 posting, with statistics specific to the Florida-Nebraska match; in contrast, the ones presented today are based on each team's cumulative season-to-date statistics.
For each of a given team's hitters (excluding those with small numbers of attempts), the player's hitting percentage is depicted as the height of a vertical bar, with the bar's width representing the number of spike attempts. Whereas I used the actual number of hit attempts as the horizontal-axis units for the Florida-vs.-Nebraska graphs, I'm now using percentage of the team's hit attempts. As you'll see, for each team I've arranged the players left-to-right from highest to lowest hitting percentages.
The ideal is for the tallest (leftmost) bars to also be the widest. That means the players with the highest hitting percentages (i.e., the most proficient) are also getting the most attempts. Here's how the four teams (listed in order of national ranking) stack up, heading into the Big Four event (you may click on the graphics to enlarge them)...


Penn State is unique in getting such a large proportion of its swings from just four players. Beyond that, however, the Nittany Lions successfully limit the number of hit attempts by their weakest attacker (in terms of hitting percentage). Penn State's article archive and stats page are excellent resources on the team.
Stanford does a good job of getting 6-foot-4 senior outside hitter Alix Klineman a lot of attempts, but might benefit from getting 6-2 frosh middle blocker Carly Wopat more sets.
Florida was, of course, led in its opening-weekend victory over Nebraska by hitting/setting double-threat Kelly Murphy, a 6-2 junior. Murphy continues to hit well and see a large share of sets in her direction. Lauren Bledsoe, who last weekend hit .533 (10 kills and 2 errors in 15 attempts) against 15th-ranked Colorado State and .625 (5-0-8) against Bowling Green State, now leads the Gators in hitting percentage. Tangerine Wiggs, who hit .833 (5-0-6) in the BGSU match and .500 (5-1-8) against Albany, has also improved since the Nebraska match. Gator stats are available here.
Finally, we have Texas, last year's national runner-up to Penn State and the only team in the Big Four to have lost a match this season (to Illinois, who is now ranked No. 3). The Longhorns' graph above appears to show the undesirable pattern of the most hit attempts going to players who do not have the highest hitting percentages (wide bars on the right). One of the players in that category, however, is senior outside hitter Juliann Faucette, a highly decorated All-America and All-Big 12 player. Faucette doesn't appear to be off to as hot a start as some of the other players, but her current hitting percentage of .292 is perfectly respectable.
Penn State, with its active 108-match winning streak, opens with Florida in the Big Four. This contest is a rematch of when the Lions and Gators met in last year's NCAA Sweet Sixteen round, a three-game sweep for Penn State (article, box score). Of note is that Penn State completely neutralized Florida's Murphy in this match, holding her to a .000 hitting percentage (2 kills, cancelled out by 2 hitting errors, in 12 attempts).
***
Other Notes: Dave Reed's ESPN.com women's volleyball column is back again this season. That's where I found one of the preview articles cited above and other miscellaneous pieces of information, including the following... You've probably heard of Sunday Night Baseball, Monday Night Football, and Friday Night Lights (high school football). Now make room for Wednesday Night Volleyball on ESPN-U, the schedule for which is available here. Most of the Wednesdays will feature doubleheaders! These telecasts will offer great opportunities for volleyball stat-heads (leatherheads?) to keep our own statistics and conduct analyses.
Monday, August 30, 2010
Summary of Florida-Nebraska Match
This past weekend saw the opening of women's college play in the U.S., with the nationally televised (on CBS College Sports cable channel) Runza/AVCA Showcase from Omaha, Nebraska taking center stage. Each match featured a Big 12 school (either Nebraska or Iowa State) taking on an SEC school (Florida or Kentucky). As it turned out, tournament organizers saved the best for last, as yesterday's closing match between Florida and Nebraska came down to an exciting finish, with the Gators prevailing 15-12 in the fifth (boxscore).
For this match, I created the two figures below (one for each team), which convey two aspects of offensive attack: players' hitting percentages (on the vertical axis) and number of hitting attempts (horizontal axis). Players are arranged left-to-right in descending order of hitting percentage. You may click on the figures to enlarge them.


The ideal would be to have rectangles that were both tall and wide, indicating that a player maintained a high hitting percentage over a large number of attempts. The Gators' Kelly Murphy epitomized this combination. Undesirable shapes are tall-and-thin (a player who hits well, but gets few attemps) and short-and-wide (a player who hits for a low percentage, but gets a lot of attempts). I've depicted these suboptimal situations in the figures with paler shades of red and blue.
Whether volleyball coaches and analysts find these graphs useful remains to be seen. One immediate application of the graphs could be in goal-setting. Players with large numbers of attempts but low hitting percentages could be shown the graph, with the coach setting the goal of some specific, higher hitting percentage for the player to work towards.
Saturday, July 17, 2010
Alexis Lebedew on Evaluating Setters
I recently received an e-mail from Alexis Lebedew of the Australian Institute of Sport, bringing to my attention some of his writings. Lebedew's focus is the evaluation of setting, a skill that has gone relatively unanalyzed over the years. The statistic of a setting "assist" exists, but because it represents the number of balls leading to kills, it overlaps considerably with hitting statistics.
In a piece entitled, "A Reconceptualisation of Traditional Volleyball Statistics to Provide a Coaching Tool for Setting" (link), Lebedew proposes a way to rate the quality of sets by taking into account not just the spike attempt following the set, but also the pass preceding the set. In short, setters are most rewarded for making "lemonade" from a "lemon" pass. As Lebedew states more technically, "...the combination of a [high-quality] spike and a [poor] pass has the top Rating... within the ‘Excellent’ outcome."
In fact, sets can be graded on a scale of 0-12, based on combinations of quality ratings for pass and spike. Lebedew notes that coaches who are used to grading passing and hitting performances on a metric different from his own (e.g., rating hit attempts on a 3- rather than 4-point scale) will still be able to construct a meaningful scale for setting, although the top value may differ from 12.
Lebedew also attempted to validate his setting metric in two ways. He first showed that computer software designed to link passes and hit attempts within the same sequences to derive set attempts only rarely missed a set attempt when compared to video footage. Second, he charted teams' percentages of sets (games) won for different averages of setting proficiency. For example, teams won roughly 95% of time when their set quality averaged 9 or higher, roughly 90% of the time when it averaged 8.5 or higher, etc., down through roughly 55% when averaging 6 or higher on setting. Lebedew encourages coaches and setters to strive for setting-proficiency averages of around 7.5-8.
All of the data were from international beach volleyball, which qualifies the generalizability of the findings in some important ways. With two-person teams, of course, there's no way to assess the setter's savviness in choosing which hitting-eligible teammate to set (as noted by Lebedew). Also, at levels of play beneath international caliber, more realistic setting-proficiency aspirations than the aforementioned 7.5-8 may need to be established.
Sunday, July 4, 2010
JQAS Article on Quality of Skill Performance and Winning Points
A recent issue of the Journal of Quantitative Analysis in Sports(Volume 6, Issue 2) contained an article by Michelle Miskin, Gilbert Fellingham, and Lindsay Florence entitled "Skill Importance in Women’s Volleyball." Access to articles is by subscription, but the journal has guest-visitor privileges for single articles.
Miskin and colleagues analyzed data for a particular women's Division I team (not identified by name) during the 2006 season. When the team played at home, play on its side of the net was videotaped and later coded. Serves, passes, and digs were rated by judges on quantitative scales (e.g., 0-to-5), sets were evaluated in terms of their distance from the net, and spike attempts were coded by area of the court from where they were hit.
Essentially, the authors appear to be looking at correlations (or associations) between characteristics and quality of skill performance, and likelihood of winning the point. As they state on page 2:
The importance score incorporates not only the impact of a specific skill..., but also the uncertainty associated with the performance... Thus, a skill whose association with scoring a point is less certain will be penalized when using this metric when compared to a skill where performance at a given level is more closely associated with a positive outcome.
The article throws a barrage of statistical terms at the reader (e.g., Bayesian analysis, Markov Chains, Dirichlet prior, Gibbs sampling, gamma distributions), some of which I was familiar with, but many of them not. Fortunately, the authors translated the complex statistical results into plain English recommendations for the team that was investigated:
1. Keep sets and passes away from the net.
2. Force the attack to the middle and right side if at all possible.
3. Devote a considerable proportion of practice time to transition offense.
4. Get to blocking positions more quickly following a serve.
Presumably, if a team wanted to apply the analytic tools described in the article in their full glory, it would need to hire a pretty high-powered statistical consultant (in addition to acquiring the videotaping and coding resources). Perhaps similar analyses could be done via more basic correlational and regression techniques, but I suspect that the resulting conclusions may be somewhat imprecise, compared to those from the fully sophisticated analyses.
Saturday, May 8, 2010
Lawson Powers Stanford to NCAA Men's Title
Stanford's Brad Lawson had an incredible offensive night as the Cardinal blew out Penn State for the NCAA title, 30-25, 30-20, 30-18. Lawson, a 6-foot-7 sophomore outside hitter who was one of four players from the state of Hawaii to take the court for Stanford tonight, compiled the following line: 24 kills with only 1 hitting error, in 28 attempts, for a remarkable .821 percentage (box score). For those who don't follow volleyball closely, a hitting percentage in the .300's would be considered very good and in the .400's, outstanding. For the season (including the championship match), Lawson hit .387 (522 kills and 143 errors on 980 attempts).
This NCAA men's volleyball records page (current only through 2006) presents two championship records, for a single match and for both games of a tournament combined:
HITTING PERCENTAGE, MATCH (MIN. 15 ATTEMPTS)
.867--Jeff Nygaard, UCLA (3) vs. Ohio St. (0), 5-7-93.
HITTING PERCENTAGE, TOURNAMENT (MIN. 20 ATTEMPTS)
.788--Rick Tune, Pepperdine, 1998 (.833 vs. Princeton, 10-0/12; .762 vs. UCLA, 17-1/21).
Nygaard's record, based on a 13-0-15 line, was achieved in a semifinal match, arguably making it slightly less impressive than a comparable hitting percentage in a championship match. Also, Nygaard was a middle blocker, as was Tune.
A couple of other notes:
*Interestingly, this year Stanford also saw an .800 hitting performance on the opposite side of the net. On February 19, Pepperdine's Cory Riecks recorded a 17-1-20 night against the Cardinal.
*As a follow-up to yesterday's posting (immediately below), Penn State managed only 4.5 total team blocks against Stanford in the title match.
Friday, May 7, 2010
Preview of Penn State-Stanford NCAA Men's Final
In anticipation of tomorrow night's (7:00 Eastern) NCAA men's championship match between Penn State and Stanford, the Nittany Lion athletic department has put out a press release that includes some interesting statistical facts.
According to the release, Penn State is 21-6 when two or more players record double-digit kills, 7-3 when two or more players record double-digit digs, and 13-2 when achieving 10 or more blocks (among other things). Such statistics can potentially provide useful insights in assessing a team's chances of winning a particular match. However, caution should be exercised for a few reasons. Before I go any further in my comments, though, I want to state that I am thrilled any time I see statistically oriented writing in the coverage of volleyball and that I intend my remarks in a constructive spirit.
First, the presented statistics do not make use of all the known information. Using the last statistic given above, the Nittany Lions are 13-2 when getting 10 or more blocks. What is their record when getting fewer than 10 blocks? As shown below, we can fill out the picture by knowing that the team's overall record is 24-7.

With all of the cells filled in, we can thus see that Penn State has a pretty good record, too, when getting fewer than 10 blocks.
Second, there is considerable variation in the quality of Penn State's opposition during the season. Playing other eastern (or midwestern) schools presumably is not as difficult as going against the traditional Mountain Pacific Sports Federation powers the Nittany Lions faced during the regular season (USC, Hawai'i, UC Irvine, BYU, Cal State Long Beach, UC Santa Barbara, and Cal State Northridge). As accessed from Penn State's game-by-game log, here are the Nittany Lions' total blocks (in red) and match outcomes against MPSF opponents:
USC 4 L(0-3)
Hawai'i 16 W(3-2)
UCI 9.5 W(3-2)
BYU 6 L(1-3)
CSULB 5 W(3-0)
UCSB 6 L(3-0)
CSUN 8.5 L(3-0)
As shown, only once in these seven matches did Penn State achieve 10 or more blocks, and it happened in a five-game match, which provides more opportunity to accumulate blocks (and other statistical markers). Blocks per game might be more appropriate to cite.
Of course, though, in a stunning turnaround from Penn State's 0-3 loss at Cal State Northridge on April 10, the Nittany Lions turned things around on Northridge in last night's NCAA semifinals, winning 3-0 on the strength of 11 blocks. Eleven blocks in three games yields a robust 3.67 average. Penn State's opponent in the championship game, Stanford, piled up 12 blocks in a three-game sweep over Ohio State.
Lastly, as is drilled into the heads of all students taking social-science research methodology courses, correlation (i.e., that two things co-occur) does not by itself prove that one thing has actually caused the other. In basketball, for example, one might find that when a given team makes under 10% of its three-point attempts, it loses the game a high percentage of the time. One might intuitively interpret such a statistic to mean that poor shooting caused the team to lose. However, the team could have been trailing in some of its games for reasons having little to do with three-point shooting and then taken a lot of desperation threes (that were missed) in an attempt to get back into those games. In other words, it may have been the losing that caused the missed shots from behind the arc. Similar examples for football are discussed here.
I could envision a volleyball scenario where a team would have a poor won-loss record in matches in which it committed a large number of service errors. Maybe the service errors cost the team a lot of points early and paved the way to eventual defeat. But, it could be that the team fell behind for reasons unrelated to serving and then decided to serve aggressively in an attempt to catch up, only to have the high-risk/high-yield serves mostly fail. Something to think about.
Wednesday, April 14, 2010
Chuck Rey's Analysis of Penn State-Texas NCAA Women's Final
Prompted by a re-airing of last December's NCAA women's final between Penn State and Texas, fellow volleyball blogger Chuck Rey has produced a statistical analysis of the match. Interested readers can compare and contrast Coach Rey's analysis to the one that I did.
Thursday, January 21, 2010
Karch Kiraly's Hypothesis on "Better" Kind of Hitting Error
There are two main types of hitting error. According to the NCAA volleyball statistical manual, one type of error involves hitting the ball somewhere other than in-bounds on the opponent's side of the court (i.e., "Hits the ball out of bounds" or "Hits the ball into the net resulting in a four-hit violation"). The other major type of hitting error is when the attacker is stuff-blocked (where the ball is "blocked down by the opposition to the same side as the attacker, and cannot be kept in play as a direct result of the block"). There are additional types of attack error such as the hitter contacting the net, back-row attack violations, and “thrown”/double-hit balls; the present analysis is not all that concerned with this last set of errors, however.
Of the two main types of error -- failing to hit the ball in bounds, and getting blocked -- ESPN commentator and former UCLA and Olympic great Karch Kiraly feels that one of these types of error is more encouraging for the team committing the faux pas and the other, more discouraging. During the Hawaii-Penn State NCAA women's semifinal broadcast about a month ago, Kiraly referred to "the better kind [of hitting error], getting blocked" (the remark occurs at roughly the 4:00 mark on this video).
In other words, given that you're inevitably going to commit errors, it's better to do so by getting blocked than by hitting out of bounds (or into the net), according to this line of argument. As the writer on College Volleyball Coach.com puts it, "I rarely get upset with my hitters when they are blocked, because I view it as the responsibility of the rest of the team to cover the hitter…" Stated differently, when an attempted spike gets blocked back toward the hitting team, the latter possibly can dig the ball back up and run another play. On the other hand, a spike attempt hit long or wide loses the attacking team the point immediately, with no chance to recover. Further, spraying a lot of balls out of bounds may indicate general shoddiness on the part of a team.
Getting blocked a lot wouldn't necessarily reflect positively on a team's offensive attack, either, though. It could mean a team's hitters and setters aren't all that adept at reading the block or taking steps to counteract it (e.g., "tooling" the block). It could also mean that a team's player's are not especially quick at getting to a ball that's been blocked back (i.e., covering the hitter).
Ultimately, it's an empirical question whether teams that commit larger shares of their hitting errors by getting blocked do better over the long run than do teams that commit a smaller share of their errors that way. We'll call this proposition the Kiraly Hypothesis. In testing the hypothesis, it's important to hold constant the number of errors made by a team, in order to focus exclusively on the type of errors.
To address the Kiraly Hypothesis (using the 2009 women's season), I first examined the final statistics for several conferences to find two (or more) teams in the same league that committed the same number (or virtually the same number) of hitting errors. One example, shown in the table below, is that Cal and Arizona St. each committed 368 hitting errors in Pac 10 competition (in all cases, only conference play is used). By going through a team's box scores, I could record the opponent's total blocks for a given focal team (e.g., when Cal played Stanford, I would record the Cardinal's total number of blocks, which indicate how often the Golden Bears got blocked; when Cal played Oregon, I would record the Ducks' total blocks; etc.). I did this for each of a focal team's conference matches and summed up the total number of times a focal team got blocked. If one wanted to, one could subtract this number from a team's total number of hitting errors in conference, to arrive at how often the focal team hit the ball out of bounds or into the net, touched the net, violated the back-row-attacker rule, etc. The latter step is not necessary for present purposes, however.
What we're left with is six paired comparisons (plus one trio). Within each pair (or trio), the teams committed essentially the same total number of hitting errors in conference play. One of the teams in a given pair would generally have a greater number of "got blocked" errors than the other. I then checked whether the team with the greater number of "got blocked" errors finished higher in the conference standings than did the team with fewer "got blocked" errors. That's what the Kiraly Hypothesis would imply, to me at least. Let's look at the following chart (which you can click on to enlarge):

As described above, Cal and ASU were paired together because they each amassed the same number of total hitting errors. Cal got blocked (i.e., erred in the "better" way) 160.5 times, whereas ASU got blocked only 151.5 times. By this logic, the Golden Bears should have finished higher in the Pac 10 standings than did the Sun Devils and, indeed, this is what happened. Score one for the Kiraly Hypothesis. (As an aside, I cannot understand how a team -- as opposed to an individual player -- can finish a match or a season with a total ending in half-blocks.)
In the fourth comparison, I grouped Utah St. and Nevada together, due to their similarity in number of times getting blocked and in their WAC win-loss records, and compared them jointly to Louisiana Tech. In all, four comparisons supported the Kiraly Hypothesis -- the team that more frequently got blocked during conference play also finished higher in the standings than its comparison school (note that the colors in columns two and three are the same in these cases).
As also shown in the chart, three comparisons contradicted the Kiraly Hypothesis. New Mexico St. is an interesting team. The Aggies finished 13-3, second in the WAC standings only to Hawai'i. Yet, despite compiling one of the highest hitting-error totals (363) in the WAC, NMSU didn't get blocked very much (see the box scores of the Aggies' matches hosting San Jose St., blocked 1 time; hosting Boise St., blocked 3 times; and hosting Nevada, blocked 3 times; NMSU additionally had three matches in which it was blocked 4 times).
Seven comparisons, of course, do not make for a very large sample. It is possible that if, say, 50 or 100 comparisons were done, the Kiraly Hypothesis would receive greater support. However, it is time consuming to compile the data for these comparisons. The most that can be said at this point is that the Kiraly Hypothesis is not so overpowering a phenomenon that its existence can be documented with only a small number of tests.
Subscribe to:
Posts (Atom)
-
Two years ago, I created a very simple prediction equation for the NCAA women's tournament. Each team gets its own value on the predicti...
-
 I was invited once again this year to vote for the Off the Block men's collegiate volleyball awards . The number of awards has increased...
 -
With this year's NCAA women's Final Four getting underway Thursday night in Seattle, today's posting offers some statistical obs...