Thursday, December 16, 2010

NCAA Women's Final Four Preview II: USC vs. California

Tonight's second semifinal match of the NCAA women's Final Four will be an all-Pac-10 battle, with the University of Southern California (USC) taking on the University of California, Berkeley. What gives this match a little extra intrigue is that these teams have already met twice this season in conference play, with USC winning both times. The Trojans actually had a harder time holding off the Golden Bears -- 17-15 in the fifth game -- October 9 in Los Angeles (boxscore) than up in Berkeley, where USC prevailed in four games (boxscore).

As usual, I've been focusing a lot on hitting percentage during the tournament, and the following table tells us which players have (and have not) done well in this season's USC-Cal head-to-head match-ups.


As discussed in yesterday's preview of tonight's other semifinal between Penn State and Texas, middle blockers will often have higher hitting percentages than outside hitters, because the latter likely receive a greater number of impromptu, desperation sets when a team is out of system. Having said that, though, USC's two giant middle blockers, Alexis Olgard (6-foot-5) and Lauren Williams (6-4, a third-team All-America), have attacked extraordinarily well against Cal this season, with hitting percentages of .389 and .349, respectively.

On the other hand, the Trojans' outside-hitting corps, led by first team AVCA All-America Alex Jupiter, has been held in check against Cal. As can be seen above, Jupiter, Falyn Fonoimoana, and Katie Fuller have all hit in the range of .222-.235 in the two matches against the Golden Bears. One important task for Trojan setter Kendall Bateman, a second-team All-America, will therefore be to get her outside hitters going.

Cal OH Tarah Murrey, powered by her fellow Cal first-team All-America, setter Carli Lloyd, has overcome any difficulties outside hitters have in recording high hitting percentages, going .364 in the Bears' two matches against the Trojans.

Middle blocker Kat Brown has held her own against SC, hitting .312, while opposite hitter Correy Johnson, an honorable mention for All-America honors, has hit .250. Adrienne Gehan (OH/opposite) and Shannon Hawari (middle) have been almost totally neutralized by USC, compiling virtually as many hitting errors as successful kills.

So there you have what I think are the key questions for tonight. Can the Golden Bears limit the damage from the Trojans' middle blockers, while still keeping the SC outside hitters under wraps? And can Tarah Murrey get a little help from her friends, as Cal tries to match SC offensively?

Wednesday, December 15, 2010

NCAA Women's Final Four Preview I: Penn State vs. Texas

The first of Thursday night's two NCAA women's national semifinal matches presents a rematch of last year's championship contest, Penn State vs. Texas. The nightcap will feature two Pac-10 foes, USC and Cal. The present write-up will focus on Penn State and Texas, with another one tomorrow for USC and Cal.

My starting point in analyzing the Nittany Lions and Longhorns is to examine to what degree, if any, the teams have changed over the past three months in their allocation of sets to different hitters and these players' hitting percentages. Back in early September, on the eve of the Big Four tournament -- with Florida hosting Penn State, Texas, and Stanford -- I presented graphs of each team's leading hitters.

The key elements of these graphs are as follows. Each team gets its own graph. The graph consists of several bars, one for each hitter. A bar's height represents that player's hitting percentage (based on some reference timeframe) and its width represents the player's share of the team's hitting attempts. For convenience, a given team's bars are arranged, left to right, from the player with the highest hitting percentage to the one with the lowest. One wants to see rectangles that are both tall and wide, signifying that players with high hitting percentages are taking the most attempts.

What we're going to see is a comparison of "old" and "new." The old graphs are the ones from September, based on matches prior to the Florida tournament. The new ones are based on teams' statistics from the first four rounds of this year's NCAA tourney, the four matches a team won to reach the Final Four.

To create the new graphs, we of course have to look at each team's tournament matches, one-by-one, before aggregating the statistics. In the first table immediately below, we see the statistical hitting lines (kills, errors, and total attempts) for each of Texas's and Penn State's main hitters, match-by-match. Together, the five listed Longhorn players accounted for 95.4% of UT's spike attempts in the first four rounds of the NCAA tournament, whereas the listed Lion players accounted for 86.5% of Penn State's spike attempts. As always, you can click on the graphics to enlarge them.


One Texas player immediately jumps out at me, namely middle-blocker Jennifer Doris, who has only one hitting error in the entire postseason (on 58 hitting attempts). In the regionals, Doris had 8 kills and no errors in 14 swings against Illinois, and 10 kills with no errors in 18 attempts against Purdue. I'll discuss Doris and other Longhorn hitters further when I get to the team's graph (below).

Among the Nittany Lions in their table, middle-blocker Arielle Wilson has performed well in most of the team's tournament matches, outside-hitter Blair Brown (who hits on the right-hand side, in contrast to most prominent OH's) excelled vs. Oklahoma, and OH Deja McClendon exhibited her most sustained productivity against Duke.

Let's now look at the graphs. The larger (light-orange) graph represents Texas in the current postseason, with the September graph (smaller, burnt-orange) shown for comparison.


Middle-blocker Rachael Adams, who was just named first-team All-America by the American Volleyball Coaches Association (AVCA), comes out as the Longhorns' highest-percentage hitter in both graphs. In what seems like a wise move (as seen by Adams's light-orange bar being wider than her burnt-orange one), UT has increased Adams's share of the team's spike attempts, from 11.6 percent in September to 18.8 percent presently.

Sha'Dare McNeal has seen her proportion of Longhorn hit attempts shrink from 17.0 to 11.3 percent, perhaps as a way of increasing Doris's swings (from 8.6 to 12.4 percent). Of course, I have no way to know if such changes are intentional or just coincidental.

Juliann Faucette (OH), who has taken about one-third of UT's swings in the postseason, joined Adams on the AVCA All-America first team. Faucette's hitting percentage is lower than those of her aforementioned teammates; however, as an outside hitter, she may be called upon to take a greater number of improvised swings to bail the team out of danger, in contrast to middle-blockers whose quick attempts tend to be by design. (See my earlier posting on out-of-system play and the related commentary on VolleyTalk.)

For Penn State, the larger (lighter-blue) graph shows the current postseason, whereas the smaller (dark-blue) graph is from September.


The Nittany Lions have featured a "big-three" attack this season, with the aforementioned Wilson, Brown, and McClendon. All three also received AVCA All-America honors, with Wilson and Brown making the first team and McClendon, the second (also being voted Freshman of the Year). Other than somewhat of a shift from September from when McClendon and Brown took about the same share of Penn State's hit attempts to the postseason, where Brown has been getting more attempts than McClendon, the Nittany Lion offense looks structurally pretty similar at the two stages of the season.

On the whole, in fact, I'm struck by both teams' consistency between their respective September and postseason graphs, even though the games comprising the September and postseason graphs are mutually exclusive.

Blocking may provide Penn State with a decisive edge in holding down Texas's hitting effectiveness. I've gone on for a long time, but let me just conclude with the observation that Penn State ranks fifth in the nation in blocks per set, whereas Texas is 35th.

Wednesday, December 8, 2010

Graphing the Trajectories or Arcs of Sets to Hitters in a Match (UCLA-Texas 2010 NCAA Second Round)

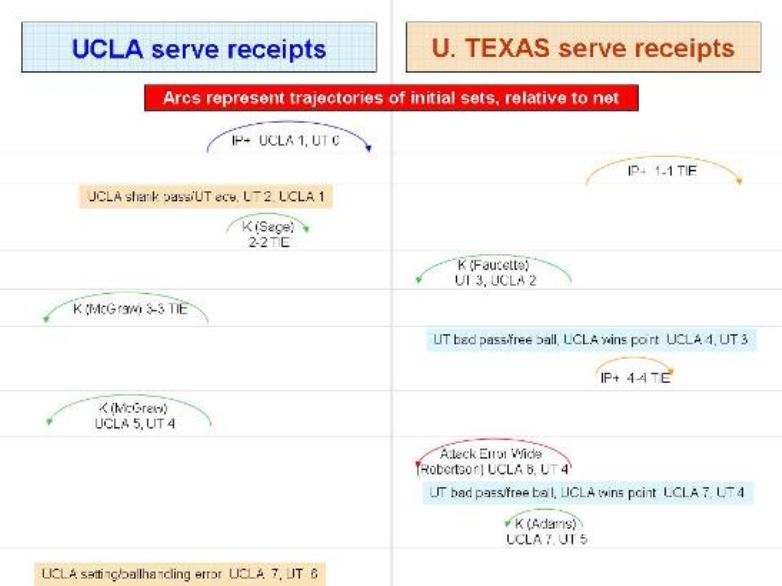
Today's entry falls under the rubric of, "It seemed like a good idea at the time." While watching last Saturday night's webcast of the UCLA-Texas women's NCAA second-round match, I decided to create what, to my knowledge, would be a novel type of play-by-play sheet that visually depicted the trajectories of each team's initial sets in mounting an attack from serve receipt.

Being able to check, at a glance, whether a team was varying its attacks between high and outside (a "4 set"), quick middle hits (a "1 set"), and other varieties of plays, and its success in siding-out with the various types of attacks, would seem to be valuable information. Further, because the webcast was shown entirely from an "end zone" camera, it was relatively easy to observe the arcs of the sets.

What I didn't bargain for was that, even graphing merely a single game (Game 2, which ended up being the only one taken by the Bruins), the process of manually creating the following PowerPoint slides from my original written notes and verifying them as best as I could against the conventional play-by-play sheet consumed several hours over the next few nights. If there is to be a future for this type of diagram -- and I'm eager to see if people think there should be -- we have to hope that someone creates special software for this purpose.

Before discussing the diagram (which actually consists of four stacked images, due to space limitations for any one image), some limitations must be acknowledged: (1) only the teams' plays directly off of serve receipt are shown, not any sets from continuing rallies; (2) the arcs and ultimate results of each play are based on my handwritten notes taken live, as there did not appear to be a way to save a file of the completed video to watch it multiple times; and (3) as a result of the second limitation, I just plain missed some serves (for example, I may have still been writing from the previous play).

OK, here are the diagrams. I would urge readers to click on each frame to enlarge it. The rectangles at the top for each team are meant to symbolize a net, relative to which the arcs of the sets can be seen. The camera was behind UCLA's end, so the charts for the Bruins are a direct reproduction of my hand drawings. For the Longhorns, I initially drew the arcs as they appeared to me and later flipped them horizontally to reflect how they would look from the UT side of the net.


As can be seen, UCLA frequently went to outside (left) hitter Dicey McGraw and she often produced kills for quick side-outs (I did not record the identity of the hitter while watching live, getting the names from the play-by-play sheet for kills and hitting errors). In contrast, Texas seemed to sport a more diversified attack, setting several different hitters at various locations along the net.

Unfortunately, conclusions and inferences are limited by having a record of just one game. Manual production of such diagrams for three or more games per match, even aided by the copy-and-paste functions, would be prohibitively time-consuming. Here's hoping that someone comes up with a way for an observer to enter minimal raw data into a software package that can generate visual diagrams similar to (or even better than) the ones above.

UPDATE:  In response to a note I put on VolleyTalk about this posting, one of the discussants suggested DataVolley as a software program for recording and plotting information from volleyball matches. There apparently is a free version one can download, as well as more elaborate versions for purchase.

Tuesday, November 30, 2010

2010 NCAA Women's Preview: Seeded Teams' Hitting Percentages Against Other Seeded Teams

For pretty much the entire four years that I've maintained this blog, I've extolled the importance of hitting percentage as a measure of a team's overall ability. To win games (sets) and matches, teams need points. Hitting percentage is based heavily on teams' productivity in winning points via kills, but penalizes teams for hitting errors, which of necessity give points to the opponent. Dividing (kills - errors) by total attempts further weakens teams' hitting percentages if a lot of their attempts are kept in play by the other team. If a team compiles a high hitting percentage and limits its opponents' hitting percentage, it will probably win a lot of matches.

Last year in previewing the start of the NCAA women's tournament, I showed that there was a strong correlation where the highest seeded teams also had the highest hitting percentages. I used teams' overall regular-season hitting percentages, however, which don't take into account degree of schedule difficulty, both across teams and within different parts of the season for any one given team.

To refine the methodology, I've done similar calculations on the eve (approximately) of this year's tournament, but looking only at seeded teams' hitting percentages against other seeded teams they played during the regular season. (You may click on the table below to enlarge it, noting also that the table appears in separate upper and lower blocks due to space limitations within a single block.)


If we were going purely on teams' average hitting percentages against other teams that ended up being seeded, then Stanford at .290 and Cal at .280 would be undervalued in the seedings (see blue circles in the right-hand column). Cal's average is based on only four matches, however, and in two of them (against Stanford) the Golden Bears hit at sizzling levels around .350. Northern Iowa really looks out of place as the No. 5 seed with its .171 average hitting percentage, which came only against some of the less higher-seeded teams.

Defense (i.e., holding opponents to low hitting percentages) appears to align better with seeding. As can be seen (literally) in the bottom line, the top five seeds each held their seeded opponents to hitting percentages around .200 (this may be Northern Iowa's saving grace).

Between the No. 6-12 seeds, nearly all of the teams held their seeded opponents to roughly .250 hitting. The one exception was No. 10 seed Minnesota, which held its seeded opponents to a paltry .185 average hitting percentage (see red circle). The Golden Gophers did allow Penn State to approach .300 in both Big Ten matches between the teams, but shut down other teams such as Duke (.044) and Dayton (.117).

The No. 13 and 14 teams, LSU and Dayton, respectively, held their seeded opponents to roughly .260 hitting. Lastly, we have No. 15 Hawaii, which played only one match all season against a team that ended up being seeded, and No. 16 Purdue. The Boilermakers were pretty "lights-out" (to borrow a baseball expression) in shutting down opponents' offenses, including in one of two matches against Penn State. The only problem for Purdue is that it hasn't hit that well itself against top competition.

We'll soon see the effectiveness (or lack thereof), in terms of prognostic success, of looking at the teams through this lens.

Friday, November 26, 2010

JQAS Article Examines Relationship Between Opponent's Blocking Strategy and Allocation of Sets to Different Hitters

The latest issue of the online Journal of Quantitative Analysis in Sports includes the article "Relationship between the Opponent Block and the Hitter in Elite Male Volleyball," by Rui Manuel Araújo, José Castro, Rui Marcelino, and Isabel R. Mesquita. A brief summary (abstract) is available here. Full-text access is by subscription, but the journal has guest viewing privileges for individual articles.

This study is based on observations from the 2007 World Cup of men's volleyball. The authors studied setters' allocation decisions in relation to two features of the opposing block:  the spacing of the blockers along the front row at the start of the point, and the type of block being faced (none, single, double, triple; the latter two also categorized as "compact" or with open spaces between the blockers). Analyses (via chi-square) were entirely two-way (allocation vs. spacing; and allocation vs. type of block), with no three-way analyses.

Because the article refers extensively to the six zones of the court often used in coaching, I created the following diagrams of the blocking team's side to illustrate the different types of initial block spacing described in the article (click here for more information on the zone system). The distinctions among the blocking arrangements mainly boil down to whether one or both outside blockers are "spread" (i.e., positioned toward the sideline) or "pinched" (i.e., positioned toward the middle blocker).


Overall, 41.2% of the sets went to teams' two left-side or "ace" hitters; 32.1% to teams' opposite (right-side) hitter; and 25% to teams' two middle hitters. The setter himself took the remaining 1.7% of attacks. Of the findings relating set allocation to characteristics of the block, here are what appear to be the main ones:
  • A "lower [frequency] than expected between ... pinched starting points and attack of the 1st middle hitter..." (of the team's two middle hitters).
  • "The individual block happened more than expected when the attack was performed by the middle hitters..., because most attacks of this player are fast and executed on the central zone of the net close to the setter ... not often allowing the double or triple block formation..."
  • "...the opposite player performed the attack against the double block situation... more than expected..."
  • "Concerning the [left-side/ace] outside hitter [both of a team's two], this player faced the individual block lower than expected and the triple block, the open triple block and the compact double block more than expected."
  • "...the open triple block was more used than expected against the [1st] left-side hitter..."
The article concludes, in part, "This study highlighted that the blockers’ 'starting points' are taken in consideration by the opponent setter to create the best conditions for the offensive players (hitters)" and that the game "at the elite male level is characterized by a constant adaptation between setter’s options and the opponent block tactics and strategies."

The article was, for the most part, straightforward to follow. However, a few little things were confusing, such as some percentages in one of the tables that should have added horizontally to 100% (where the total at the end of the row even said 100%), but the numbers didn't in fact sum to 100. This kind of research is difficult to do, however, with extensive videotaping and coding of matches, so I commend the authors for their work.

Tuesday, November 9, 2010

Side-Out Success Based on Whether Teams Stay "In System" on Serve-Receipt

Increasingly, it seems, one hears of volleyball teams getting "out of system" or having to recover from same. According to Bonnie Kenny and Cindy Gregory's book Volleyball: Steps to Success, "Out-of-system play occurs during a rally when something happens to take the team away from the preferred pass, set, hit or dig, set, hit sequence" (p. 141). I decided several weeks ago that, while watching several upcoming matches on television, I would keep some statistics on women's college teams' ability to stay in-system on their serve receipt, and how this would relate to their likelihood of ultimately winning the rally (i.e., siding-out).

I coded one game (set) each from the following matches: Illinois at Minnesota (box score, ESPN 3 video); South Carolina at Florida (box score); Nebraska at Texas (box score); Oklahoma at Texas A&M (box score); and Penn State at Michigan (box score).

As teams attempted to run their offense in immediate response to the opponent's serve, it was usually pretty easy to classify whether they were in or out of system. Certainly, if someone other than the setter made the second contact, or if the team was aced or made an overpass, it was out of system. I also considered a sequence to be out of system (although not as egregiously) if the setter had to tip (with one hand) or bump the ball to the hitter. In addition, I recorded whether the receiving team successfully sided-out (not just an immediate side-out, i.e., serve, pass, set, kill, but all side-outs, regardless of how long the rally lasted).

I clearly expected teams to exhibit greater side-out success rates when their initial response to the opponent's serve was in, as compared to out of, system. To get an idea of the magnitude of the difference, however, we needed some empirical data, hence the following analyses. The following chart (which you can click on to enlarge) contains the key information. The data should be considered only an approximation, as I sometimes missed a play or two per game (sometimes it was my fault due to a momentary lapse of attention, but other times things were outside of my control, such as a TV replay interrupting the beginning of the next point). Because the numbers for any one team would be too small for statistical analysis, I added up the data for each column for all the teams, thus producing aggregate figures.


When teams mounted an in-system (i.e., pass, set, spike) response to the opponent's serve, they sided-out nearly 63% of the time (102/163). In stark contrast, when the serve-receipt got out of system, the team sided-out only around 10% of the time (4/39). For statistically trained readers out there, this difference in percentages is highly significant via a chi-square test (X2 = 34.5, df = 1, p < .001).

It did not surprise me that teams rarely win the point when they start off out of system. It surprised me a little bit, though, that teams did not side-out more frequently when they mounted an in-system response to serve. A spike cleanly set up and delivered is no guarantee of winning the point, however, as the ball can be blocked or dug. As anyone who saw this past weekend's Penn State-Michigan match knows, there was a sequence in Game 1 during which the Wolverines consistently mounted in-system attacks -- and consistently got stuffed by the Nittany Lions!

Another thing I found interesting, albeit which must be qualified by the small number of observations, is the variation in how often teams got out of system. National No.1-ranked Florida never went out of system in the game I coded, whereas the Gators' tough serving knocked South Carolina out of system a whopping 10 times. On average, teams got out of system 3.9 times within the span of one game (set).

This investigation, like many of my previous ones, aimed to provide an initial look at a phenomenon, in this case out-of-system play, and put some ideas out there for operational measures and statistical analyses. Further research could examine whether particular servers are adept at getting the opponent out of system, as well as probe in/out-of-system status not just in response to the opponent's serve, but also to spikes and free balls.

UPDATE:  This topic has generated some interesting discussion at VolleyTalk. Here's a link to the thread.

Saturday, October 2, 2010

Texas Tech Ends 64-Match Conference Losing Streak


Texas Tech University's women's volleyball team tonight ended its 64-match losing streak in Big 12 conference play, with a five-game win over Kansas. I'm on the faculty at Texas Tech, so I've eagerly been awaiting this day! The Big 12 schedule is 20 games (Oklahoma State doesn't field a volleyball squad, so each team has 10 opponents, each played home and away). The Red Raiders won their conference opener in 2007, then dropped their remaining 19. Seasons of 0-20 followed in 2008 and 2009, and then the team started off 0-5 in the Big 12 this year.

Tonight's win seemed less a matter of Texas Tech raising its overall team hitting percentage compared to the previous five losses (black bars in the graph immediately below), than dramatically curtailing the opponent's hitting percentage (blue bars in the second graph). 


The Red Raiders recorded 17.5 blocks against Kansas to contain the Jayhawks' offense (Texas Tech's block total is, of course, going to be high simply due to the five-game length of the match, but even prorating for number of games, it's still one of the team's best blocking efforts of the season).

There have been at least two other favorable signs for the Red Raiders, of late. One is the improved hitting of offensive workhorse Amanda Dowdy (who has taken roughly one-third of the team's spike attempts this season), as shown in the red bars above. Dowdy injured an ankle in the Baylor match, but showed no ill effects tonight.

Texas Tech also had nine aces against Kansas. I attended an earlier Raider match this season, a three-game loss to Kansas State, where Texas Tech had only one ace. It seems the team is serving a lot more aggressively now, which should make it harder for the opponent to side-out.

Semi-Retirement of VolleyMetrics Blog

With all of the NCAA volleyball championships of the 2023-24 academic year having been completed -- Texas sweeping Nebraska last December t...